In today’s rapidly evolving business landscape, staying ahead of the competition requires more than just a great product or service. It demands a deep understanding of the market, consumer behavior, and emerging trends. This is where the market research process becomes invaluable. In this blog post, we will delve more into market research and explore...
There is never a wrong time to do market research. However, most research projects are birthed because a company or organization is at a crossroads. Whether you’re a startup or Fortune 500 company, you’ll have critical decisions to make. This blog will detail common market research examples and how our clients have used them to...
A proposal for market research is a document that works as a template for the research team and client, determining the steps to take in proper order. What’s more, they ensure the project runs smoothly and follows a key set of steps.
Market research proposals typically include the following:
Objectives: The purpose of this section is to clearly define the key goals of the market research project. Like any other project, when there are no objectives, things can get messy–fast. Labeling the project objectives works to avoid this and ensures the rest of the proposal makes sense.
Type of approach: While the objectives section is the most important, the approach section has the most details. Going over each step of the entire process is critical for this point, as it almost acts as a map of how the project will go.
Project timeline: Just as it sounds. Including a timeline in a market research proposal is necessary to ensure the client is aware of how the project will progress. Additionally, this helps to keep the research team aware of deadlines and goals.
Estimated cost: Pricing will always be included in a market research proposal. Usually, costs for a project will be a fixed price. Like many aspects of market research, costs depend on different variables within the project.
Another key detail to point out here is that proposals are especially important because there are so many different types of market research methods to choose from.
While the four elements listed above are essential in a proposal for any type of research project, their details will vary based on the type of research being conducted.
A research team that’s well-versed in multiple industries will be able to craft an effective research proposal that’s unique to their client.
Below, we’ll expand on the points mentioned above.
A market research proposal includes a set amount of key components. Each section offers essential information and should always be reviewed to ensure you are selecting the best market research agency for the job.
Below are the key components of a market research proposal:
Proposal Component #1: Objectives
This is the general recap of key questions that need to be answered in the market research.
It should address your expectations, what you want to learn from the market research, and what you plan to do with the results.
In this section of the proposal, the market research company should communicate how well they listened and understood the key objectives of your project from the prospecting meetings.
This is an important component of a market research proposal.
It is important both sides have a clear understanding of what the general goals and objectives of the research are.
Your objectives will shape survey or interview questions, and guide the final results. Do not hesitate to discuss any comments or concerns when you receive the proposal.
Proposal Component #2: Approach
In this section of the market research proposal, the firm should outline the approach.
This approach should set the table for the types of methodologies of choice and most importantly, why they are the best options for the client.
Here the proposal may talk about approaches to market research such as:
Whatever the methodology is, the firm should spend some time discussing the value of each methodology and why it was chosen over other options.
For instance, online surveys offer the best return on investment (ROI) for a client. This is because online surveys are cost-effective, offer a quick turnaround, and capture quality data.
This is part of the story we share for our market research case studies. All great market research companies have a patented process.
Proposal Component #3: Design
Now that the approach is laid out, the market research company should get into the details here.
The design phase of the market research proposal outlines the structure of each of the market research instruments.
This component of a market research proposal may include:
This section should explain some of the questions the market research company is considering asking, how long the survey or interview will take, what populations the market research will be targeting, and so on.
For example, if the market research company is proposing focus groups, the proposal will discuss the location of the groups, honorariums, recruitment methods, and more.
This is the crux of the market research proposal. The detail is in the design and it’s where the market research company can shine.
The design component is where they can show their expertise and experience. This is where the pretenders are separated from the contenders.
Proposal Component #4: Fieldwork
During the fieldwork section of the proposal, this is where your organization will read about the number of groups, the number of survey completes, or the number of interviews.
You may also learn about how the firm proposes cutting the audiences or creating quotas.
Here the market research firm should also share how the project will start with a soft-launch email survey before fully launching fieldwork.
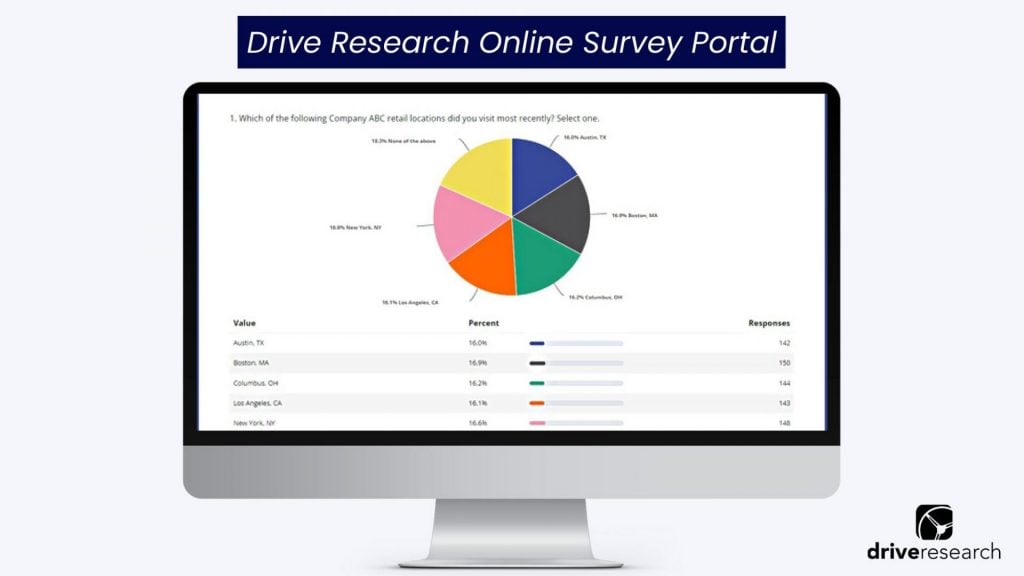
Additionally, in this section of our market research proposals, we also share with our clients that they will receive a live data link that they can access 24/7 with a passcode.
This gives our clients up-to-the-second data when their project is active.
The reporting component is another key section of the market research proposal. This is where your team will read about the analysis and reporting plans of the market research company.
It should give you a mental picture of how the report will be structured.
This would most likely include:
An executive summary
Recommendations
Infographic
Customer persona
An appendix of question-by-question results
Depending on the complexity of the project, the market research firm should also touch on some advanced analytics such as TURF analysis, text analytics, regression, correlation, or any other non-traditional form of reporting.
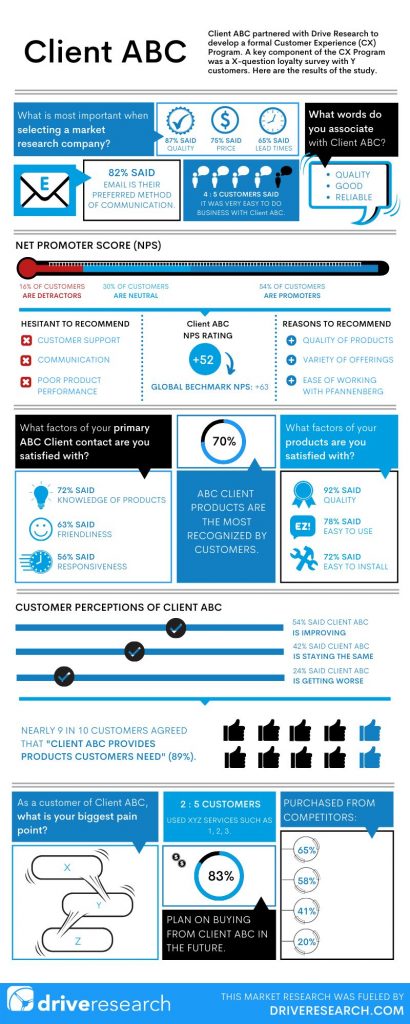
Below is an example infographic you might receive from a market research company, like Drive Research.
Example Infographic of a Market Research Report
Proposal Component #6: Timeline
In one of the final sections of the market research proposal, the market research firm should highlight the timeline.
This not only includes a total start-to-finish estimate in weeks (or months) but a breakdown of each section.
Our market research firm often finds Gantt charts work very well for these timelines. The breakdown here should include kickoff, set up, design, fieldwork, and reporting.
Lastly, the market research project proposal must highlight the expenses. This total cost is often what our clients (and any human being) want to jump to first.
We typically either include this on the cover page or at least in the email sent to the client. The cost should give some details on how it came to be.
For instance, the cost of market research could be based on hourly rates and the time expected to complete each task.
The scope should also talk about the hard pass-through costs such as incentives or rentals of panels.
What A Proposal Tells You About a Market Research Company
Here are a few things to consider when reviewing a market research proposal from agencies and firms.
How quickly do they turn it around?
Understanding the estimated project timeline showcases how fast the market research company can move. More importantly, it reflects how much of a priority your project is for them.
If they are taking a week or longer to produce a fairly straightforward and simple proposal, they may not be considering you as a priority client.
Speaking from experience, the research industry moves fast. A week is an eternity in business as far as our market research company is concerned.
How clean and professional does it look?
The layout and format of a market research proposal will give you some insight into what their reporting, infographics, and deliverables will look like.
A sloppy thrown together proposal is a sign of bad things to come. Remember, this should be the phase where a third-party market research firm is trying to win you over.
If the first document you receive from a vendor is not up to your standards, it is likely not the firm you’d like to move forward with.
How flexible is the market research company?
Are they willing to work with you on scope, process, and cost if your budget requires it?
If they show some flexibility and are willing to make adjustments as part of the proposal process, it is a sign they will be easy to work with throughout the coming weeks.
At our market research company, we like to act as an extension of your team. In the proposal phase, we try to do everything we can for your team to meet your goals.
How consultative is the market research partner?
Market research companies often get a bad rap for being laser-focused on charts, numbers, and analytics. They sometimes fail to see the bigger picture: How can clients use this data to improve everyday business operations?
While we can speak for other firms, we can certainly speak behind the mission of Drive Research.
Sure, we love statistics and data as much as the next analyst. However, every market research project includes a level of consultation to assure our clients are walking away with actionable insights.
Here are a few ways we add consultative elements to the market research process:
If a prospective client asks for a quote for phone surveys, but we know online surveys are the fast and more cost-effective option, we’ll share pricing for both phone surveys and online surveys. We always have our clients’ (and participants’) best interests in mind.
Our proposals often include detailed information about the market research process such as where we sample survey respondents, project work plan, key deliverables, and more.
Our market research reports include actionable recommendations for how our clients can use their unique data to improve sales, marketing, operations, and other areas of their business.
Every project ends with a debrief meeting where our team reads the report page-by-page to assure all parties have a full understanding of the data.
How responsive are they?
If you send an email to a prospective market research vendor asking them a question about the scope or price, it should not take days to get a response.
Think of it this way, the service is likely not going to get better once they close the project and have you as a client.
The best service you will get from any company is when they are trying to get you to sign the dotted line. Sad but very true.
For more context about choosing a market research company, watch this short 60-second video.
Final Thoughts
A market research proposal may seem simple enough.
And while this type of document isn’t difficult to construct, it contains many moving parts–which all depend on the needs of the client. This is why it’s crucial to have the proposal handled by a team of trustworthy experts!
Aside from containing the necessary information, an effective market research proposal will be handled by an equally effective market research team. Covering everything from key objectives to costs, a well-written proposal is the first step to a successful market research project.
Drive Research is a full-service market research company. We provide both qualitative and quantitative research services to organizations across the world.
If you are interested in receiving a market research proposal from Drive Research, contact us today!
We analyze more than data—we also track how our site is used to improve your experience. Cookies help us understand what’s working so we can deliver the most relevant insights. Click “Accept” to enable full functionality.
Functional
Always active
The technical storage or access is strictly necessary for the legitimate purpose of enabling the use of a specific service explicitly requested by the subscriber or user, or for the sole purpose of carrying out the transmission of a communication over an electronic communications network.
Preferences
The technical storage or access is necessary for the legitimate purpose of storing preferences that are not requested by the subscriber or user.
Statistics
The technical storage or access that is used exclusively for statistical purposes.The technical storage or access that is used exclusively for anonymous statistical purposes. Without a subpoena, voluntary compliance on the part of your Internet Service Provider, or additional records from a third party, information stored or retrieved for this purpose alone cannot usually be used to identify you.
Marketing
The technical storage or access is required to create user profiles to send advertising, or to track the user on a website or across several websites for similar marketing purposes.