In today’s rapidly evolving business landscape, staying ahead of the competition requires more than just a great product or service. It demands a deep understanding of the market, consumer behavior, and emerging trends. This is where the market research process becomes invaluable. In this blog post, we will delve more into market research and explore...
There is never a wrong time to do market research. However, most research projects are birthed because a company or organization is at a crossroads. Whether you’re a startup or Fortune 500 company, you’ll have critical decisions to make. This blog will detail common market research examples and how our clients have used them to...
What Is Correlation Analysis? [+ How to Measure & Interpret]
Tim Gell
Ever wondered if higher customer satisfaction leads to more repeat purchases? Or if increased marketing spend really drives more sales? Correlation analysis helps answer these questions by measuring the strength and direction of relationships between two variables.
By providing a clear perspective on which factors impact your business the most, you can allocate resources more effectively, reduce risks, and uncover hidden opportunities for growth.
In this blog, we’ll break down what correlation analysis is, how to calculate it, and—most importantly—how to interpret the results. Let’s dive in!
Find out what truly drives business success with our expert correlation analysis services.
Correlation analysis in market research is a statistical method used to measure the strength and direction of relationships between two or more variables. In simple terms, it helps uncover patterns within a dataset.
At its core, correlation analysis identifies how variables are related. Using specific formulas, the result is a numerical value between -1 and +1.
For example, let’s examine the relationship between Variable A and Variable B:
A result close to +1 indicates a positive correlation—as Variable A increases, Variable B also increases.
A result near -1 signals a negative correlation—as Variable A increases, Variable B decreases.
A value around 0 suggests little to no meaningful relationship between the two variables.
While this type of advanced analytic technique typically examines two variables at a time, you can analyze multiple variables simultaneously using a correlation matrix, which presents them in both rows and columns.
The Drive Research team explores more into the definition of correlation analysis in the video below.
Correlation Coefficients (Pearson vs. Spearman)
Pearson Coefficient
The Pearson Correlation Coefficient (r) measures the strength and direction of the linear relationship between two continuous variables.
It assumes that both variables are normally distributed, have a linear relationship, and are measured on an interval or ratio scale.
The coefficient ranges from -1 to +1:
+1 indicates a perfect positive linear relationship,
-1 indicates a perfect negative linear relationship,
0 indicates no linear relationship.
This coefficient is particularly useful for understanding how changes in one variable relate to changes in another.
Spearman’s Coefficient
Spearman’s Rank Correlation Coefficient (ρ or rs) measures the strength and direction of the monotonic relationship between two ranked variables.
It assumes the data can be ranked and that the relationship between the variables is monotonic. A monotonic relationship consistently increases or decreases, but is not necessarily linear.
The coefficient ranges from -1 to +1:
+1 indicates a perfect positive monotonic relationship.
-1 indicates a perfect negative monotonic relationship.
0 indicates no monotonic relationship.
Spearman’s coefficient is useful when data do not meet the assumptions of Pearson correlation, particularly with ordinal data or non-linear relationships.
Key Difference
This table provides a clear, side-by-side comparison of the two correlation methods, making it easier to understand when and why you would use each one.
Feature
Pearson Coefficient
Spearman’s Coefficient
Type of Relationship
Linear (assumes a straight-line relationship)
Monotonic (consistent increase or decrease, not necessarily linear)
Data Type
Continuous, interval or ratio scale
Ordinal or ranked variables
Best For
Measuring linear relationships between continuous variables
Measuring relationships in ordinal data or non-linear relationships
Example Use Case
Analyzing the relationship between marketing spend and sales revenue
Studying the correlation between employee satisfaction ranks and employee retention
How to Measure Correlation
Before you can analyze the correlation between two variables, you’ll first need to conduct an online survey. This process includes designing, programming, and fielding the survey. Once completed, the results are used to determine correlation strength scores.
These surveys typically contain a variety of questions, making them ideal for use as variables in advanced analysis techniques.
For more context, here is the process our online survey agency follows to measure correlation.
Step 1. Write the survey
The first step in conducting a correlation analysis in market research is designing your survey. Be sure to plan your questions in advance, keeping in mind the data you need for the analysis.
Focus on questions that yield numerical or ordinal data. These might include:
Think of metrics such as:
Agreement scales
Importance scales
Satisfaction scales
Money (ex. spending amount)
Temperature
Age
Step 2. Program + field the survey
Once your survey is finalized, it’s time to program and test it to ensure the questions are functioning correctly. This step is crucial, as mislabeled scales or improper data validation can compromise the data used for correlation analysis.
After thorough testing, proceed with launching the survey to your targeted respondents.
Step 3. Analyze the correlation between two variables
Once you’ve collected enough responses, clean the survey data to maintain its integrity before running the correlation analysis.
As a reminder, the two most common methods for running a correlation are:
Pearson r correlation: Best used when the relationship between variables is linear, quantitative, and free from outliers.
Spearman rank correlation: Ideal when you want to assess how one ranked variable increases or decreases as the other ranked variable changes.
Most data analysis software offers built-in tools to automatically run correlation analysis once the inputs are entered. For example, you can easily run a correlation using spreadsheet software like Microsoft Excel.
Here’s a helpful video of our Research Manager, Tim Gell walking you through the process of calculating a correlation coefficient using Excel.
Let us handle your full correlation analysis study—from survey design to detailed analysis.
Correlation coefficients range from -1 to +1, where the value indicates the strength and direction of the relationship between two variables.
A value of 0 signifies no correlation, while +1 or -1 represents a perfect positive or negative correlation, respectively. The higher the coefficient (closer to +1 or -1), the stronger the relationship between the two variables.
All correlation strength scores and classifications are outlined below.
Perfect Correlation (0.80 to 1.00)
A coefficient in this range indicates an almost perfect relationship between the two variables. As one variable changes, the other variable changes in a predictable and consistent way. For example, a strong positive correlation could exist between height and shoe size.
Strong Correlation (0.50 to 0.79)
Variables in this range are strongly related, but the relationship is not perfect. There is a significant association, and changes in one variable tend to be associated with changes in the other. An example might be the relationship between advertising spend and sales revenue.
Moderate Correlation (0.30 to 0.49)
A moderate correlation suggests a noticeable relationship, though other factors might also influence the variables. For instance, there could be a moderate correlation between customer satisfaction and brand loyalty, but it’s not always a direct cause-and-effect relationship.
Weak Correlation (0.00 to 0.29)
A weak correlation indicates that there is little to no meaningful relationship between the two variables. While changes in one variable may slightly affect the other, the connection is weak and unreliable. For example, age and preferred color might have a weak correlation in certain consumer studies.
Correlation Analysis Example
Employee surveys are a great example of how correlation analysis is used to identify relationships between different factors and overall employee satisfaction.
By analyzing how various independent variables (such as salary or benefits) impact a dependent variable (such as employee satisfaction or eNPS), employee survey vendors can gain valuable insights to improve employee engagement and retention.
Example: Analyzing eNPS with Correlation
Let’s consider a common employee net promoter score (eNPS) question: “How likely are you to recommend working at our company to a friend or family member?” This question is typically answered on a 1-10 scale, where 1 reflects “not at all likely” and 10 reflects “very likely.”
The resulting eNPS score serves as the dependent variable in this analysis.
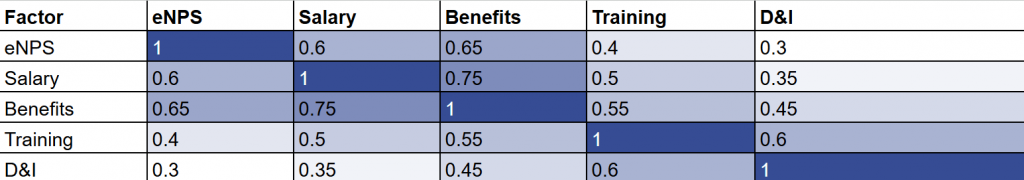
To uncover how different organizational factors impact eNPS, we include additional survey questions to assess employee satisfaction with various factors, such as salary, benefits, training, and diversity & inclusion. These factors will be the independent variables.
How Correlation Analysis Helps
Correlation analysis will help determine which of these independent variables have the strongest relationship with eNPS. For instance, if salary and benefits have a correlation coefficient of 0.6, it indicates a strong correlation with eNPS—suggesting that higher satisfaction with salary and benefits is linked to a higher likelihood of recommending the company.
Below is an example of a correlation matrix showing the relationship between eNPS and various organizational factors:
Benefits of Finding Correlation Analysis in Market Research
There are several reasons to consider running a correlation analysis in your next market research study.
Get more from your data
For one, planning a correlation analysis motivates market researchers to ask better questions in the survey.
Knowing many variables will be examined during the analysis, researchers will spend more time thinking through all the most important and relevant data that should be collected.
Make more informed decisions
Once you have the data, the correlation analysis helps you identify which variables have the strongest relationships.
Unforeseen negative or positive correlations may help businesses make better-informed decisions.
Even though correlation analysis results are not a great predictor themselves, they can still inform future qualitative or quantitative research.
For instance, you may discover a significant pattern between variables that inspires additional research.
A great counterpart to regression analysis
Correlation analysis also nicely leads to regression analysis. By comparison, regression analysis tells you what Variable A might look like based on a particular value of Variable B.
In other words, correlation tells you there is a relationship, but regression shows you what that relationship looks like.
Drawbacks to Measuring Correlation
Correlation analysis is useful to understand how variables interact with one another.
That said, pitfalls exist and have to be looked out for if you choose to run the survey in-house. Drawbacks to measuring correlation include:
Coincidences within the results
One of those biggest pitfalls is you may get a result that shows a strong correlation, either negative or positive.
Take customer satisfaction, for example. Through the analysis, you may find customer experience is highly graded and correlates strongly with overall satisfaction.
To say that one is directly causing the other could be faulty and should be carefully considered.
There are many factors at play that could just be a coincidence when reviewing correlation analysis statistics, and it’s essential to make conclusions within the scope of reason.
Correlation is not causation
Only use correlation analysis if you understand and can explain to a client that correlation is not causation.
It is tempting to jump to the conclusion that two variables have a direct result on each other, but this analysis is meant for identifying connections, not predicting them.
That said, when there is an interest in discovering relationships between two or more variables, correlation analysis is an excellent fit in a market research project.
Correlation analysis in research allows for a deeper look into variables within a business or industry.
To assure 100% confidence, we recommend partnering with a market research company like Drive Research.
Our team of experts has years of experience using correlation analysis to analyze feedback from our client’s employees, customers, and other audiences.
Want to include correlation analysis in your next research study? Contact Drive Research for a quote.
We analyze more than data—we also track how our site is used to improve your experience. Cookies help us understand what’s working so we can deliver the most relevant insights. Click “Accept” to enable full functionality.
Functional
Always active
The technical storage or access is strictly necessary for the legitimate purpose of enabling the use of a specific service explicitly requested by the subscriber or user, or for the sole purpose of carrying out the transmission of a communication over an electronic communications network.
Preferences
The technical storage or access is necessary for the legitimate purpose of storing preferences that are not requested by the subscriber or user.
Statistics
The technical storage or access that is used exclusively for statistical purposes.The technical storage or access that is used exclusively for anonymous statistical purposes. Without a subpoena, voluntary compliance on the part of your Internet Service Provider, or additional records from a third party, information stored or retrieved for this purpose alone cannot usually be used to identify you.
Marketing
The technical storage or access is required to create user profiles to send advertising, or to track the user on a website or across several websites for similar marketing purposes.