In today’s rapidly evolving business landscape, staying ahead of the competition requires more than just a great product or service. It demands a deep understanding of the market, consumer behavior, and emerging trends. This is where the market research process becomes invaluable. In this blog post, we will delve more into market research and explore...
There is never a wrong time to do market research. However, most research projects are birthed because a company or organization is at a crossroads. Whether you’re a startup or Fortune 500 company, you’ll have critical decisions to make. This blog will detail common market research examples and how our clients have used them to...
Ad Concept Testing Analysis Methods [Examples & Best Practices]
Tim Gell
Ad concept testing is a critical part of any serious marketing campaign.
If you’re going to make a big investment to run new ads, consider a much smaller investment in marketing and advertising research first. Doing so ensures confidence in your marketing strategy.
While conducting marketing research is important, the ad concept testing analysis is just as critical to ensuring you are relying on quality data.
In this post, I’ll cover five excellent methods for ad concept testing analysis. Each of these options will get you one step closer to optimizing your ad campaign.
Optimize your ad strategy with data-driven insights. Let our market research firm guide your ad concept testing.
Once you make the wise decision to test your ads before a campaign launch, be sure to also do it right. Don’t settle for simple and informal ad testing.
This is especially true if your company or client has plenty at stake with the campaign. If you are thinking about hiring a marketing agency for ad concept testing, be sure to also read this first.
The first approach that may come to mind for ad concept testing is a head-to-head comparison or “A/B testing” of the ads you are considering.
Perhaps you show some of your target audience a collection of the ads to test and ask them to pick their favorite. Or running both of the ads for a few days to see which offers the better return.
Would this give a quick answer for your campaign? Yes, but at a serious cost: oversimplifying the decision.
Benefits to Marketers
A full ad concept testing survey is a better solution that can give you the key context and details about each individual ad and how they compare to one another. You can expect to understand why respondents like or dislike certain ads. This information is invaluable when you consider that each ad may be more effective with a different segment of your target audience.
The resulting research may guide you to target different audiences for each ad, revisit the design of an ad, or scrap a poor ad altogether.
In any case, ad concept testing helps you make a better business decision and can save you significant money from running an inefficient ad campaign.
Evaluating ad concepts effectively requires a range of analytical tools, each suited to different stages and objectives. This section dives into the diverse advanced analytic techniques we use to test ad concepts, from heat maps to video sentiment graphs.
Rather watch a video? See an overview of these three ad concept analysis techniques below.
1. Heat Maps
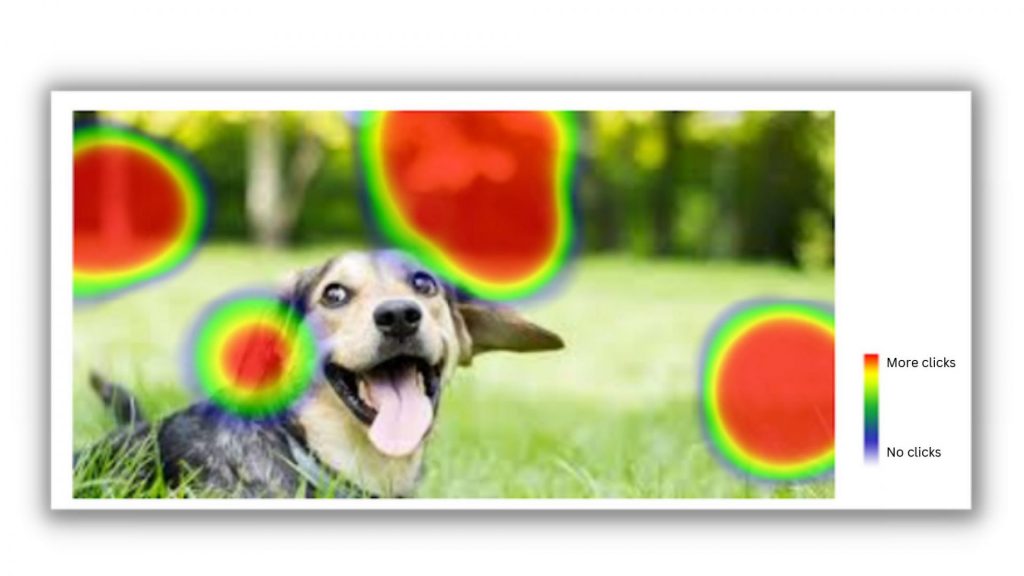
A heat map analysis can be a powerful tool for testing still ads. Instead of just having a respondent tell you they like or dislike your ad, you see what parts they like and how much.
Here’s how it works – a survey question displays the image of your ad and respondents are asked to select points of interest.
Heatmaps track where respondents clicked on the parts of the advertisement they liked and disliked. They also measure the intensity, or amount, of clicks on a location. This is where the “heat” comes from.
The end result for reporting is an image of the ad with a layover plotting all respondent selections.
Frequently selected areas are warm colors (red, orange, yellow), and infrequently selected areas are cool colors (purple, blue, green).
See some great examples of heat map survey questions in this post.
The image above shows the results of a heatmap question. The red areas indicate where most clicks occurred whereas the more yellow, green, and blue areas detail areas of fewer clicks.
For example, think of a weather radar map showing a thunderstorm over an area. Locations in red or purple are getting more severe weather than the locations in yellow or green.
This ad concept testing analysis method instantly proves its worth if you learn that only one or two elements of your advertisement need to be adjusted instead of the whole image.
It provides helpful direction and takes the guesswork out of what exactly needs changing for success.
Survey respondents can also leave comments to provide more context.
Therefore, to determine the reasoning behind respondent selections, it is often worth diving into the individual comments.
The comments especially come in handy when an area of the ad receives a similar amount of likes and dislikes.
2. Text Highlighter
A text highlighter question is just a heatmap for text. Similar to showing respondents an image, a block of text is displayed.
The respondent is asked to highlight which areas of the text they like and dislike and offer comments.
The results will show the words/sentences highlighted more in darker shades of color and text highlighted less in lighter shades. Also similar to image heatmaps, only one set of highlights can be shown.
3. Analyzing Video Advertisements or Commercials
The benefits of ad concept testing are not only limited to digital and print ads. There are several options to consider to test a video advertisement or commercial.
Here’s how to ask and analyze questions pertaining to video elements.
Open-ended questions
After showing a commercial or ad clip to the respondent, you could ask one or two open-ended questions to gauge feedback.
Questions such as “What did you like the most?”, “What did you like the least?”, or “What did you remember most from the ad?”.
Since these are qualitative questions, no data is numerical.
However, coding responses for common themes after all the data has been obtained could be performed to gather some quantitative figures.
Rating scales
Most video follow-up questions include rating scales because of the benefits they provide!
First, rating scales are easy for a respondent to answer. This enhances the respondent experience which increases survey response rates and data quality.
Second, the data can be interpreted without stress. Scales can be numerical (i.e., 1 to 5) or descriptive with conversing statements (i.e., agreement scales – strongly disagree, somewhat disagree, neutral, somewhat agree, strongly agree). Also, scale values can be manipulated afterward to give you a more comprehensive analysis.
Third, rating scales can be combined with an open-ended question to utilize the advantages of both quantitative and qualitative research. Asking a respondent to justify their rating gives additional qualitative context to the quantitative component.
Video sentiment graphs
While this format is not as common, it can still be very insightful and fun!
Video sentiment graphs basically provide you a snapshot of how a respondent felt in real-time as they watched the ad.
Here’s how it works: A respondent will be asked to use a slider scale as they watch the ad.
The endpoints on the scale will represent competing sentiments (i.e., like and dislike). The respondent will move the point on the scale to either end throughout the ad.
A line graph will appear illustrating the respondent’s sentiment.
The y-axis represents the variation of sentiment.
When the respondent showed favorable sentiment, the line will draw higher. During times of negative sentiment, it will move lower.
The x-axis represents the time of the ad in seconds.
4. TURF Analysis
Another useful technique in an ad concept testing survey is TURF analysis.
No, this isn’t the turf you might find on a football field (although turf fields could be the subject of a TURF analysis).
What is TURF analysis?
Broadly speaking, this ad concept testing analysis method tells you how to reach the maximum amount of people with limited space for offerings. To explain it a little better, let’s look at an example within an ad concept testing analysis.
Example of Using TURF Analysis for Ad Concept Testing Pretend your company or client has developed five unique still advertisements for an upcoming campaign. They all hit on the same underlying message in different ways, and you know each one is at least somewhat appealing to your target audience. You only have the budget to run three of the five ads, so you need to understand which combination of three will appeal to the highest total percentage of your target audience.
In our example above, you may ask respondents to select all displayed ads that they find most appealing or give them a positive impression.
On the back end, TURF analysis will evaluate all possible combinations of three ads from the tested five to see which one gets you closest to 100% of respondents.
It is worth noting, however, that you may not always receive a clear-cut answer in the end. This could occur because multiple unique combinations of ads have the same total reach.
Even if there is no obvious winning combination, the results will still assist you in making an informed decision on which ads are worth using.
5. Text Analysis
Sometimes the best way to capture insight in an ad concept testing analysis is to hear from your target audience in their own words.
This is often done through open-ended questions in your survey where a respondent can elaborate on their rationale and thoughts behind an answer.
The trouble is, not every researcher has the time and human resources to read every single response or hand-code responses into buckets for analysis.
This is where the text analysis technique shines.
What is text analysis?
Text analysis uses automation and sometimes artificial intelligence to efficiently and effectively find the main topics in your open-ended questions.
The process groups respondents’ answers based on similar keywords, synonyms, and other contexts.
The Benefit to You: The goal is to walk away with a list of the top themes or topics in the responses to see what is really driving respondents. You can even analyze other key metrics in the ad concept testing survey by text analysis topic. This additional layer of analysis may tell you which topics are associated with a higher willingness to purchase your product, for example.
When the frequency of topics is not enough, you can also look at sentiment.
Using assigned values for nearly every English word, a net positive, neutral, or negative sentiment can be calculated for a respondent’s answer.
From here, you can assess what percentage of answers for a topic was positive, neutral, or negative as a whole.
This may reveal which individual topics around a tested ad elicit positive reactions or negative reactions.
Your company or client can then focus on leveraging the positive topics and minimizing the negative ones for better ads.
Designing a survey that achieves your objectives depends on the content and delivery of what is being asked.
Therefore, it’s essential to understand the types of question formats best for analyzing the data obtained. This is especially important for ad concept testing when gauging feedback on key visuals and messages.
Drive Research is a national market research company specializing in ad concept testing. We partner with brands across the country to design, program, field, and analyze ad concept testing surveys.
To learn more about our services, contact our team today!
We analyze more than data—we also track how our site is used to improve your experience. Cookies help us understand what’s working so we can deliver the most relevant insights. Click “Accept” to enable full functionality.
Functional
Always active
The technical storage or access is strictly necessary for the legitimate purpose of enabling the use of a specific service explicitly requested by the subscriber or user, or for the sole purpose of carrying out the transmission of a communication over an electronic communications network.
Preferences
The technical storage or access is necessary for the legitimate purpose of storing preferences that are not requested by the subscriber or user.
Statistics
The technical storage or access that is used exclusively for statistical purposes.The technical storage or access that is used exclusively for anonymous statistical purposes. Without a subpoena, voluntary compliance on the part of your Internet Service Provider, or additional records from a third party, information stored or retrieved for this purpose alone cannot usually be used to identify you.
Marketing
The technical storage or access is required to create user profiles to send advertising, or to track the user on a website or across several websites for similar marketing purposes.