In today’s rapidly evolving business landscape, staying ahead of the competition requires more than just a great product or service. It demands a deep understanding of the market, consumer behavior, and emerging trends. This is where the market research process becomes invaluable. In this blog post, we will delve more into market research and explore...
There is never a wrong time to do market research. However, most research projects are birthed because a company or organization is at a crossroads. Whether you’re a startup or Fortune 500 company, you’ll have critical decisions to make. This blog will detail common market research examples and how our clients have used them to...
8 Customer Satisfaction Metrics to Measure & Track in 2027
Emily Rodgers
Customer Satisfaction Metrics in Short: The most common customer satisfaction metrics include Customer Satisfaction Score (CSAT), Net Promoter Score (NPS), and Customer Effort Score (CES). These measure satisfaction, willingness to recommend, and ease of interacting with a business.
Companies can also track likelihood to switch, customer retention, churn, customer lifetime value, and social media sentiment for a broader understanding of the customer experience.
Our recommendation would be to use a combination of metrics that reflects your business objectives rather than relying on a single score.
Customer satisfaction metrics help businesses measure how customers feel about their experiences, identify what influences loyalty, and understand where improvements are needed.
Some metrics come directly from customer surveys, while others track behaviors such as repeat purchases or cancellations.
The tricky part is deciding which numbers are worth paying attention to.
For example, a company could have a strong Net Promoter Score (NPS) while customers are increasingly frustrated with the time it takes to get support. Looking at NPS alongside satisfaction with specific service areas would give the company a better idea of what needs attention.
At Drive Research, we recommend choosing customer satisfaction metrics based on what your organization wants to learn and the decisions it needs to make. Below, we’ll explain eight common metrics, how to calculate them, and when each is most useful.
What are Customer Satisfaction Metrics?
Customer satisfaction metrics are measurements used to evaluate how customers perceive a company’s products, services, and overall experience.
They help businesses answer questions such as:
How satisfied are customers with the service they receive?
How likely are customers to recommend the company?
What parts of the customer experience cause frustration?
Are customers becoming more or less loyal over time?
Some metrics require directly asking customers for feedback. Others use information already available through sales records or customer databases.
For instance, CSAT measures reported satisfaction, while customer retention rate measures the percentage of customers who continue doing business with a company.
Both can contribute to understanding the health of a customer relationship, but they tell you different things.
We typically recommend looking at customer satisfaction metrics together, particularly when organizations are trying to understand why retention is changing or where their customer experience could improve.
Which Metrics Should You Use to Measure Customer Satisfaction?
If your objective is to evaluate customer loyalty, NPS may be a useful starting point. If you want to understand why customers struggle with your support process, Customer Effort Score will likely provide more relevant feedback.
The right customer satisfaction metrics depend on what you want to measure.
Here is how eight common customer satisfaction metrics compare.
Customer satisfaction metric
What it measures
Best used for
Customer Satisfaction Score (CSAT)
Satisfaction with a company, product, service, or interaction
Evaluating overall satisfaction or specific customer experiences
Net Promoter Score (NPS)
Likelihood of recommending a company
Benchmarking customer advocacy and tracking loyalty-related sentiment
Likelihood to Switch (LTS)
Customers’ stated likelihood of moving to another provider
Identifying potential retention risks
Customer Effort Score (CES)
How easy or difficult an experience is for customers
Finding friction in support, onboarding, or purchasing
Customer Retention Rate (CRR)
Percentage of customers retained over a period
Monitoring ongoing customer relationships
Customer Churn Rate (CCR)
Percentage of customers lost over a period
Evaluating customer attrition
Customer Lifetime Value (CLV)
Estimated value of a customer over the relationship
Understanding the financial importance of customer relationships
Social Media Metrics
Public feedback and interactions with a brand
Monitoring visible complaints, praise, and recurring feedback themes
An important distinction: CSAT, NPS, likelihood to switch, and CES can be measured through customer surveys. Retention, churn, and customer lifetime value generally rely on internal business data. Social media metrics provide another source of feedback, but they should not be treated as representative of your entire customer base.
It is one of the most straightforward metrics to include in a customer satisfaction survey.
A common CSAT survey question is:
Overall, how satisfied are you with [Company]?
Respondents might answer on a five-point scale ranging from “Very dissatisfied” to “Very satisfied.”
CSAT can measure overall satisfaction with a company, but it is also useful for evaluating specific parts of the customer experience.
For example, a B2B organization might ask customers to rate their satisfaction with their account manager separately from their experience with customer support. The results would show which areas are performing well and which deserve additional attention.
One mistake we see in customer research is placing too much emphasis on overall satisfaction. A company-wide score can look positive even when customers are unhappy with an important department or service.
How to calculate CSAT
A common method is to calculate the percentage of respondents who select the two most positive options on a five-point scale.
CSAT = (Number of satisfied customers ÷ Total valid responses) × 100
If 80 of 100 respondents choose “Satisfied” or “Very satisfied,” the CSAT score is 80%.
Other scoring methods exist, so it’s important to define how satisfaction will be calculated before launching your survey.
When to use CSAT: Choose this metric when you want to benchmark satisfaction with your business or understand how customers rate a particular experience.
2. Net Promoter Score (NPS)
Net Promoter Score (NPS) measures how likely customers are to recommend a company, product, or service to someone else.
It is commonly used as a measure of customer advocacy and loyalty-related sentiment.
The standard NPS question is:
On a scale of 0 to 10, how likely are you to recommend [Company] to a friend or colleague?
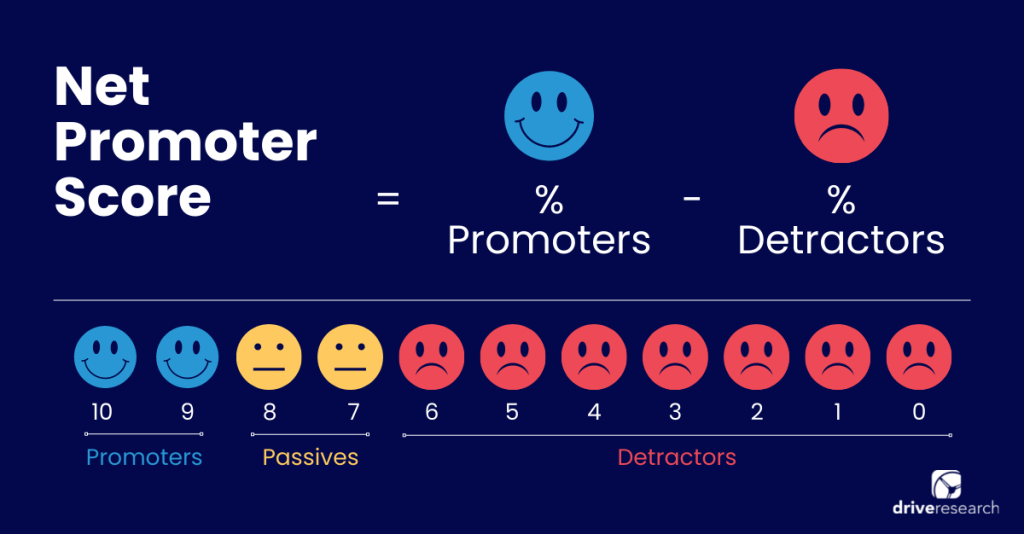
Based on their responses, customers are placed into three groups:
Promoters (9–10): Customers who are highly likely to recommend the company.
Passives (7–8): Customers who provide a moderately positive recommendation rating.
Detractors (0–6): Customers who are less likely to recommend the company.
How to calculate NPS
NPS = % of Promoters − % of Detractors
For example, imagine that 100 customers complete an NPS survey. Of those respondents, 60 are promoters, 25 are passives, and 15 are detractors.
The company’s NPS would be:
60% − 15% = +45
NPS scores range from -100 to +100.
When to use NPS: NPS is particularly useful for companies that want to establish a consistent customer advocacy benchmark and monitor changes over time.
Research Tip: Ask an open-ended follow-up NPS question
At Drive Research, we also recommend including a follow-up question asking customers why they provided their rating.
A company might find that promoters appreciate its knowledgeable account team, while detractors are frustrated with service delays. Those explanations give leadership a much clearer starting point for deciding what to improve.
3. Likelihood to Switch (LTS)
Likelihood to Switch (LTS) measures how likely customers say they are to stop doing business with their current provider and move to a competitor.
A typical LTS survey question might be:
How likely are you to switch to another provider in the next 12 months?
Customers answer using a five-point scale ranging from “Very unlikely” to “Very likely.”
Some organizations prefer asking about likelihood to renew or continue purchasing. The wording should reflect how customers typically maintain or end their relationship with the business.
How to measure likelihood to switch
A simple approach is to report the percentage of respondents who say they are “Likely” or “Very likely” to switch.
For example, if 18 of 100 customers select those responses, 18% of respondents are considered likely to switch under that definition.
The calculation is straightforward. Interpreting the responses requires more care.
Someone may report a high likelihood of switching because they’re dissatisfied with service. Another customer may be considering a competitor because their company is consolidating vendors or changing purchasing requirements.
When to use LTS: We recommend considering this metric when customer retention is a major business objective, particularly for organizations with recurring contracts or ongoing customer relationships.
It can also be helpful to compare likelihood to switch across customer segments. A business may find that newer customers are more open to alternatives than longstanding accounts.
LTS measures stated intentions, however, so it should not be treated as a precise prediction of future churn.
4. Customer Effort Score (CES)
Customer Effort Score (CES) measures how easy or difficult it is for customers to complete a task or interact with a company.
CES is particularly helpful for evaluating experiences where customers need to accomplish something, such as resolving a support issue or completing an onboarding process.
A common customer effort score question is:
How easy was it to resolve your issue with our company?
Respondents might use a five-point scale, where 1 means “Very difficult” and 5 means “Very easy.”
How to calculate CES
CES can be reported as the average response on the selected scale.
For example, if five customers provide ratings of 5, 4, 4, 3, and 4, the average CES is:
(5 + 4 + 4 + 3 + 4) ÷ 5 = 4.0 out of 5
Some organizations instead report the percentage of customers who describe an experience as easy.
There is no single universal CES scale. Some questions measure agreement with a statement, while others ask respondents to rate ease or difficulty directly.
⚠️ Make sure you know which direction is positive before interpreting or comparing scores.
On an ease scale, higher may be better. On a difficulty scale, lower may be better.
When to use CES: Use CES when you want to evaluate a particular customer process and identify unnecessary friction.
5. Customer Retention Rate
Customer Retention Rate (CRR) measures the percentage of customers a business keeps during a defined period.
Unlike CSAT or NPS, customer retention is generally calculated using internal customer records rather than survey responses.
How to calculate customer retention rate
CRR = [(Customers at end of period − New customers acquired) ÷ Customers at start of period] × 100
Imagine a company starts the year with 500 customers, acquires 100 new customers, and ends with 550.
Its retention rate would be:
[(550 − 100) ÷ 500] × 100 = 90%
This means the business retained 90% of the customers it had at the beginning of the year.
Keep in mind that a customer may remain with a provider even when dissatisfied. Long contracts, switching costs, or limited alternatives can all influence retention.
For this reason, we recommend comparing retention data with direct customer feedback when trying to understand the health of customer relationships.
When to use CRR: Retention rate is especially relevant for subscription businesses and companies with ongoing service agreements.
6. Customer Churn Rate (CCR)
Customer Churn Rate (CCR) measures the percentage of customers who stop doing business with a company during a defined period.
Churn is closely related to retention, but it focuses on the customers lost.
How to calculate customer churn rate
Customer Churn Rate = (Customers lost during period ÷ Customers at start of period) × 100
If a business begins the quarter with 200 customers and loses 12, its churn rate is:
(12 ÷ 200) × 100 = 6%
This calculation assumes a customer-count definition of churn. Revenue churn is a separate measure that tracks lost recurring revenue.
Churn also becomes more useful when paired with information about why customers leave.
For example, a company might conduct an exit survey with former customers to understand whether cancellations are related to dissatisfaction, changing business needs, or price.
The results can help the business distinguish problems it can address from losses driven by circumstances outside its control.
When to use churn rate: Track churn when customer attrition affects revenue forecasts or when leadership wants to evaluate the effectiveness of retention efforts.
7. Customer Lifetime Value (LTV)
Customer Lifetime Value (CLV) estimates the value a customer generates throughout their relationship with a business.
CLV helps organizations understand the financial importance of retaining customers. It can also provide context when prioritizing investments in customer experience improvements.
How to calculate customer lifetime value
There are several ways to calculate CLV. A simplified revenue-based approach is:
CLV = Average annual customer revenue × Average customer lifespan
If a customer generates $5,000 in annual revenue and stays with the business for four years, their estimated revenue-based lifetime value is $20,000.
A more complete calculation would consider costs, profit margins, and the timing of future revenue.
When to use CLV: CLV is helpful when evaluating how customer retention influences the financial performance of a business.
For example, a company may discover that customers with longer relationships have substantially higher lifetime values. If satisfaction research identifies recurring service issues among those customers, the company has additional information to help evaluate the potential business impact.
CLV does not directly measure customer satisfaction. It is a financial metric that can help connect customer experience research to business outcomes.
8. Social Media Metrics
Social media metrics can help businesses monitor customer feedback expressed publicly through comments, reviews, and online conversations.
For customer satisfaction purposes, the most useful social media information often comes from the content of customer interactions rather than follower counts or impressions.
A business might monitor:
Positive and negative sentiment in customer comments
Frequency of recurring complaints
Customer feedback about recent product or service changes
Changes in review ratings over time
How to measure social media feedback
Organizations can categorize public comments by sentiment or topic, then track how frequently different themes appear.
For example, a retailer might notice an increase in comments about delayed deliveries following a change in shipping providers.
This type of feedback can help identify an issue that deserves closer investigation.
However, social media comments are self-selected. Customers who post publicly may have unusually positive or negative experiences, so their feedback should not be assumed to represent all customers.
When to use social media metrics: Consider these measures as a supplementary source of customer feedback, especially when you want to monitor emerging concerns between formal survey waves.
Choosing the Right Customer Satisfaction KPIs
Start with the business decision your research needs to support. The most useful customer satisfaction metrics are the ones that help your organization understand a specific problem or evaluate progress toward a goal.
At Drive Research, our third-party customer survey planning typically begins with a discussion of what the client wants to learn.
We’ve worked with businesses concerned with customer loyalty who wanted to understand whether customers are considering other providers. While others experienced complaints about support needed to measure satisfaction with specific teams and customer touchpoints.
Those objectives should shape the questionnaire from the beginning.
“Before choosing which customer satisfaction metrics to track, we need to understand what the business wants to learn. NPS might tell us how likely customers are to recommend a company, but it won’t explain which parts of the customer experience need improvement. That’s why we often recommend measuring satisfaction with specific departments or services alongside broader loyalty metrics.”
Chris Coville
Research Principal, Drive Research
Match Your Metrics to Your Research Objectives
A few examples illustrate how the decision changes the measurement:
Business objective
Metrics to consider
What the combination can tell you
Understand overall customer loyalty
NPS and likelihood to switch
How customers feel about recommending the business and whether they’re considering alternatives
Improve customer service
CSAT and CES
Whether customers are satisfied with support and how easy it is to get help
Reduce customer attrition
Likelihood to switch and churn rate
How reported intentions compare with actual customer losses
Evaluate long-term customer relationships
NPS, retention rate, and CLV
How customer advocacy relates to continued business and financial value
Research Tip
A survey does not need to include every metric. Adding questions that won’t influence a decision increases the burden on respondents without necessarily improving the research.
Before adding a question to your survey, ask what your organization will do differently based on the result.
If the answer is unclear, revisit whether the metric belongs in the study.
Decide Whether You Need Relationship or Transactional Metrics
Customer satisfaction research generally falls into two useful categories.
Relationship research evaluates how customers feel about the company overall. These studies often include NPS, overall satisfaction, and likelihood to continue doing business.
Transactional research focuses on a specific experience, such as a purchase or support interaction. CSAT and CES are often useful here because the questions can be tied directly to what the customer just experienced.
Some organizations benefit from both approaches.
For instance, an annual customer satisfaction survey can provide a broad relationship benchmark, while shorter surveys after support interactions help identify operational issues throughout the year.
Think About Who Should Answer
The right respondent matters just as much as the right metric.
In B2B research, the person who uses a company’s product every day may have a different perspective from the executive who approves the contract renewal.
If both opinions matter, the research plan should account for those roles.
We also recommend identifying the customer groups you’ll want to compare before launching the study. Customer tenure, account size, and product usage may all influence how results should be analyzed.
Customer satisfaction metrics are most useful when you examine what’s driving the scores and how results differ between customer groups.
An overall CSAT score of 85%, for example, tells you how many respondents reported satisfaction under your scoring definition. It doesn’t explain what customers appreciate or which experiences are causing frustration.
We recommend going beyond the overall score in several ways.
Compare Results Across Customer Segments
Averages can hide meaningful differences in the customer experience.
Imagine a company reports an NPS of +40. That may look encouraging as an overall result.
But what if established customers have an NPS of +55 while newer customers have an NPS of +5?
The company would want to explore whether newer customers are encountering problems that longstanding customers no longer experience.
Customer segment analysis can help identify these patterns, although differences should be interpreted with the sample size of each group in mind.
For B2B customer surveys, this might include comparing results by account type or customer tenure.
Ask Customers Why They Gave Their Ratings
Open-ended questions help explain the reasons behind quantitative scores.
After an NPS question, we often recommend asking respondents why they selected their rating.
Similarly, customers who report low satisfaction with a particular service area may receive a follow-up question about their experience.
One important consideration is making the question specific enough to produce useful feedback.
For example, asking customers why they rated a particular department poorly may provide more actionable feedback than a broad question asking what the company could do better.
“We pay attention to how customers interpret the questions we’re asking. For example, customers might not know the difference between their account manager and the general customer service team. If those roles aren’t clearly explained, the satisfaction ratings can become difficult to interpret.”
Chris Coville
Research Principal, Drive Research
Clear question wording helps ensure customers are evaluating the experience you actually want to measure. It is especially important in B2B research, where different departments may serve similar roles from the customer’s perspective.
Sometimes different metrics point to the same issue. Other times they reveal a more complicated customer relationship.
Consider a business with high overall satisfaction but relatively low willingness to recommend.
Customers may appreciate the service they receive without feeling strongly enough about the company to recommend it.
Another business might have strong NPS but see an increase in likelihood to switch among a particular customer segment.
In either situation, examining the follow-up feedback helps the company determine what might explain the difference.
Best Practices for Tracking Customer Satisfaction Metrics Over Time
Tracking customer satisfaction metrics means measuring the same KPIs at planned intervals so you can identify changes in customer experiences and attitudes.
A single survey provides a snapshot. Repeated research helps organizations evaluate whether their customer experience is improving or getting worse.
For ongoing customer satisfaction studies, there are a few practices we typically recommend.
Keep Core Survey Questions Consistent
If you’re tracking CSAT or NPS year after year, maintaining consistent question wording and response scales helps preserve comparability.
Changing a satisfaction scale from five points to seven points makes it more difficult to compare results directly.
That doesn’t mean your customer survey can never change.
At Drive Research, we often recommend the 80/20 rule for recurring customer surveys.
Keep 80% of questions consistent to track changes over time, while updating the remaining 20% to explore new priorities, emerging issues, or changing customer needs.
The goal is to improve the survey while protecting the questions needed for reliable trend reporting.
Choose a Measurement Frequency That Fits Your Business
Annual measurement is a reasonable starting point for a broader relationship-based customer satisfaction survey. It gives an organization time to review findings and make improvements before measuring again.
For businesses with frequent customer interactions, transactional surveys may make more sense. Retailers, healthcare providers, and hospitality companies, for example, can collect feedback shortly after a purchase, appointment, or stay.
These shorter surveys can be conducted more frequently to identify issues as they occur rather than waiting for an annual survey.
Survey frequency should also reflect how often your organization can realistically act on customer feedback.
Investigate Meaningful Changes Before Reacting
A decline in a customer satisfaction metric should prompt further analysis.
First, examine whether the survey audience, sample composition, or question wording changed.
Next, look at differences between customer groups and review the open-ended feedback.
An apparent decline in overall satisfaction might reflect a different mix of respondents from the previous survey rather than a comparable decline within every customer segment.
It’s also important to consider sample sizes and whether observed differences are large enough to support a meaningful conclusion.
Connect Survey Results to Business Changes
Customer satisfaction tracking becomes particularly helpful when companies document which improvements they make between survey waves.
Imagine a business receives recurring feedback about slow response times. After reviewing the results, it changes its support process.
In the next survey, the company can compare satisfaction with customer support against its earlier benchmark.
The survey alone may not prove that a particular operational change caused a shift in satisfaction, but the combined information provides a more informed basis for evaluating progress.
Drive Research is a market research company specializing in customer satisfaction surveys for B2B and B2C organizations across the country and world.
Our team helps clients determine which customer satisfaction metrics are worth measuring based on their research objectives. We also manage survey design, data collection, analysis, and reporting.
For organizations with an existing survey program, we can review the questionnaire and recommend changes while preserving important benchmarks.
Ready to understand what your customer satisfaction metrics are telling you?
We analyze more than data—we also track how our site is used to improve your experience. Cookies help us understand what’s working so we can deliver the most relevant insights. Click “Accept” to enable full functionality.
Functional
Always active
The technical storage or access is strictly necessary for the legitimate purpose of enabling the use of a specific service explicitly requested by the subscriber or user, or for the sole purpose of carrying out the transmission of a communication over an electronic communications network.
Preferences
The technical storage or access is necessary for the legitimate purpose of storing preferences that are not requested by the subscriber or user.
Statistics
The technical storage or access that is used exclusively for statistical purposes.The technical storage or access that is used exclusively for anonymous statistical purposes. Without a subpoena, voluntary compliance on the part of your Internet Service Provider, or additional records from a third party, information stored or retrieved for this purpose alone cannot usually be used to identify you.
Marketing
The technical storage or access is required to create user profiles to send advertising, or to track the user on a website or across several websites for similar marketing purposes.