In today’s rapidly evolving business landscape, staying ahead of the competition requires more than just a great product or service. It demands a deep understanding of the market, consumer behavior, and emerging trends. This is where the market research process becomes invaluable. In this blog post, we will delve more into market research and explore...
There is never a wrong time to do market research. However, most research projects are birthed because a company or organization is at a crossroads. Whether you’re a startup or Fortune 500 company, you’ll have critical decisions to make. This blog will detail common market research examples and how our clients have used them to...
How to Calculate the ROI of Software/SaaS with Market Research
George Kuhn
When companies are on the hunt for new software or SaaS, there are several boxes that must be checked before they move forward. However, perhaps the most influential deciding factor is the average return on investment (ROI) the solution provides its current customers.
Being transparent about the return on investment of software/SaaS helps accelerate the buyer’s journey. Here’s how to easily calculate your platform’s ROI and competitors with market research.
Providing either a percentage increase (for revenue) or decrease (for cost reductions) helps accelerate the buyer’s journey. It makes it easier for someone to create a shortlist of companies they want to move forward with.
Therefore many platforms choose to share the ROI of their software/Saas being that it is a real driver to potential buyers. And a great way to calculate return on investment is with market research.
For instance, our market research company worked with one of the world’s largest cloud computing platforms on a survey project. The study targeted IT decision-makers in the U.S to generate value proposition insights that would encourage new users to sign up.
Turn insights into action—contact us for a custom SaaS ROI study.
The cloud computing platform knew of the immense benefits its marketplace provided its commercial users.
However, it struggled to provide the correct lead messaging as part of its value proposition without having concrete data and detailers from its users.
The brand wanted to better understand the usage patterns of its marketplace, purchasing drivers, consumption models, and the savings the platform provided.
The cloud computing platform also wanted to understand the impact of COVID-19 on users, top features, before and after usage benefits, and the lead value proposition for the marketplace brand.
Quote from George Kuhn, President of Drive Research Many businesses, tech solutions, and software companies struggle to calculate their ROI. By reaching out through a formal and systematic process using a third-party market research firm, ROI can be calculated. We have an experienced analytical team who works with brands to reverse engineer the customer experience to explore the touchpoints that build into the brand’s ROI models and determine the best metrics and measurements for the calculation: time, dollars spent, opportunity cost, etc.
The Headlines
The results of the market research study addressed all of the primary and secondary objectives for the client.
The results would be part of the marketplace brand’s public relations (PR), sales collateral, and content strategy. Findings were also heavily integrated into the sales team CRM and conversations to help communicate ROI and new user acquisition.
Here are a few key takeaways we discovered when calculating the ROI of the software.
1. The study found that over one-third of the awareness of the marketplace was generated through the core brand’s website.
Over 3 in 10 (31%) users first learned about the marketplace through the brand website. Other top sources included industry peers or colleagues (19%), online search (14%), and conferences or trade shows (12%). All other sources generated less than 10% of mentions.
2. The NPS of the marketplace stood at +59, ahead of the global benchmark by 19 points.
Via delighted.com, a popular NPS benchmark site, the cloud computing platform marketplace would be in the 100th percentile of NPS in the software industry.
The low NPS in software was +29, and the high was +55, including organizations such as:
Adobe
Microsoft
Google
Intuit
Sony
McAfee
Activision
Apple
Symantec
Blackboard
Via customer.guru, the top NPS ratings across all industries are Starbucks (+77) and Costco (+79).
3. Users of the marketplace described it as efficient, valuable, flexible, and easy.
Respondents were asked to choose from an aided list of words to describe their marketplace experience to add further context to the user experience and the high NPS.
The top choices were efficient (77%), valuable (71%), flexible (68%), and easy (62%).
These top four choices had a significant gap ahead of the rest of the word associations. The only other words chosen by more than 20% of users were streamlined (37%) and custom-built (29%).
4. Issues with off-the-shelf integrations and potential contracting issues topped the barriers/concerns to trying the marketplace.
Respondents were asked about the top initial barriers or concerns before using the marketplace for the first time.
Atop the list were issues with off-the-shelf integrations (35%) and potential contracting problems (33%).
Lesser concerns included the expense of buying through the marketplace versus direct (30%), the marketplace favoring sellers over buyers (27%), and vague/contradictory seller policies (24%).
All concerns were mentioned by at least 20% of respondents.
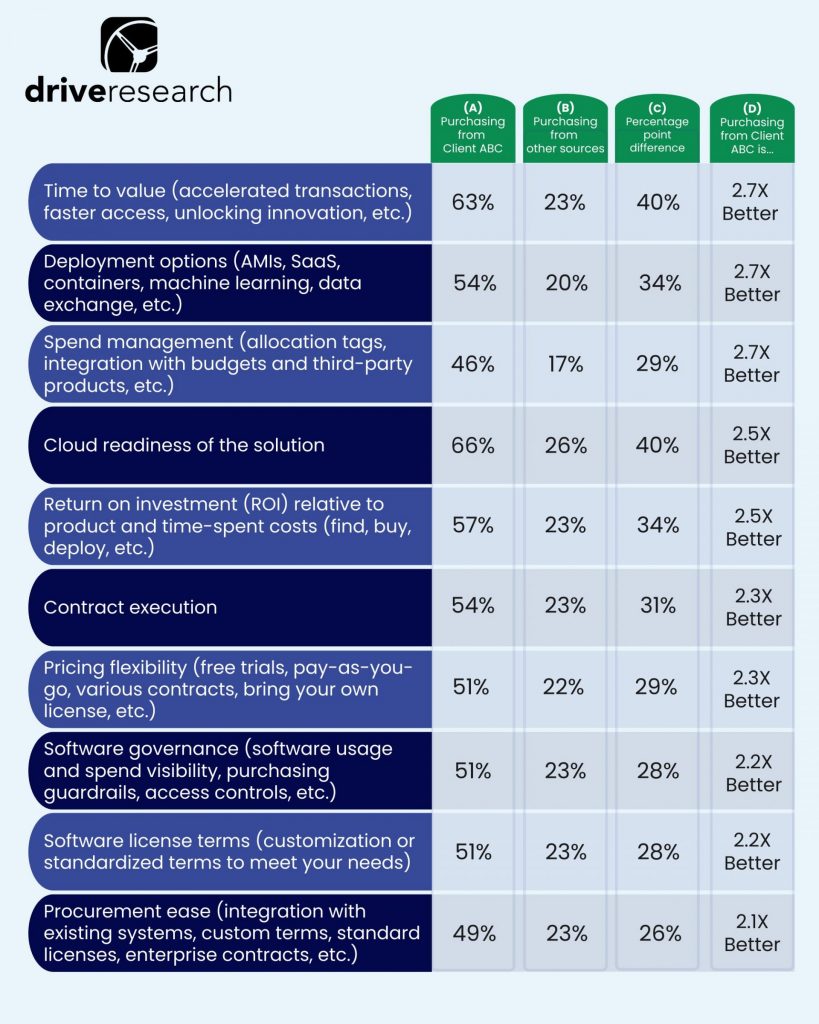
5. On average, users of the marketplace felt an average of 2.4X better about their experience compared to other sources across 10 different categories.
Respondents were asked to compare past purchases through the marketplace to purchases through non-marketplace sources. By far, the brand’s marketplace outperformed in every single tested category that spans the customer experience (CX).
Time to value (accelerated transactions, faster access, unlocking innovation, etc.): 2.7X better/more satisfied
Software license terms (customization or standardized terms to meet your needs.): 2.2X better/more satisfied
Procurement ease (integration with existing systems, custom terms, standard licenses, enterprise contracts): 2.1X better/more satisfied
The Key Takeaway
The entire series was a compelling storyline for the marketplace team to showcase across all marketing collateral. The gap in satisfaction across all factors tested was statistically significant based on sampling probability. The generalized statistic where users were 2.4X more satisfied was framed in various resources, webinars, and content. The 2.4X was also broken down and individualized based on the needs of each strategic account.
For example, if pricing flexibility is essential to Corporation ABC. In that case, the sales deck featured statistics that reference users were 2.3X more satisfied when using the marketplace on this factor when compared to other non-marketplace solutions.
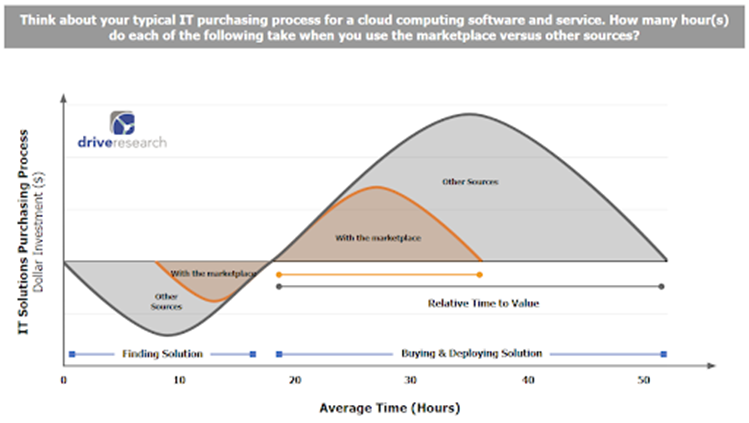
6. ITDMs cut their time in half using solutions through the marketplace compared to other sources.
Organizations saved an average of over $2,000 in ITDM valued time when purchasing a cloud computing software or service.
Across all 500 respondents, respondents spent an average of 17.6 hours finding a cloud computing software and service, 11.5 hours buying, and 23.3 hours deploying when they did not use the marketplace via other sources.
The hours are compared to the same respondents spending an average of 9.5 hours finding, 5.4 hours buying, and 12.1 hours deploying when using the marketplace. It represents an average time savings of 46% for finding, 53% for buying, and 48% for deploying when using the marketplace.
The average time savings of $2,057 were calculated using the survey’s average hourly rate of ITDMs. It was multiplied by the average hours of time savings for each of the 3 steps (finding, buying, and deploying).
The Key Takeaway
The time savings (hours) and value savings (dollars) were built-into prospecting calls and presentations for the client. It was coupled with actual product cost savings purchased through the marketplace to calculate total usage savings. These statistics pushed organizations to reevaluate the value proposition of buying solutions. The cost savings showcased were a significant driver to influence usage of the marketplace going forward.
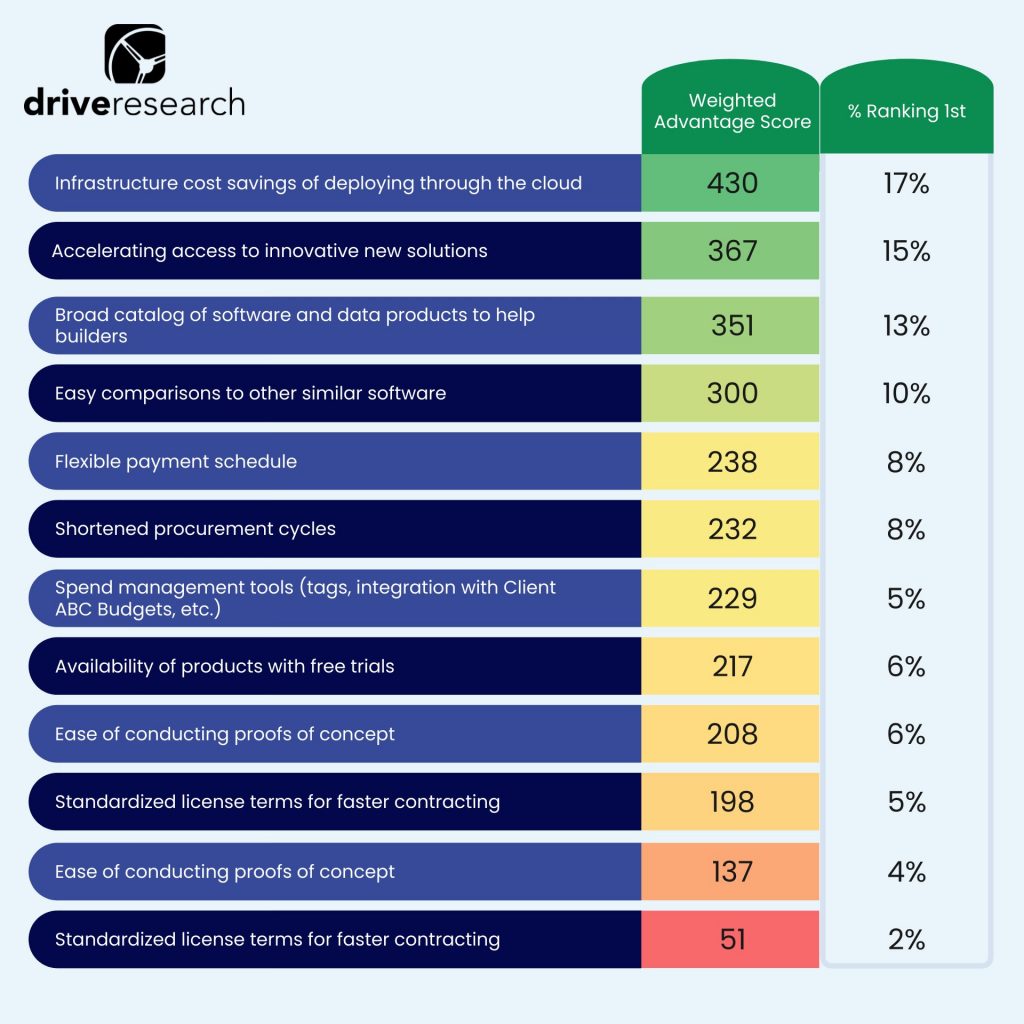
7. Infrastructure cost savings of deploying through the cloud, accelerating access to innovative new solutions, and a broad catalog of software and data products to help builders are the 3 top advantages of using the marketplace.
The feedback from this question identified critical benefit statements for the marketplace.
Ranking these benefits forced respondents to consider trade-offs to select the top 3 choices through a forced-choice model. Respondents were asked to rank the top 3 choices among 12 advantages.
Scoring was based on a weighted system where a 1st rank = 3 points, a 2nd rank = 2 points, and a 3rd rank = 1 point. The scores were added together to create a weighted advantage score.
The Key Takeaway
These top advantages helped the marketplace team understand the value proposition of the cloud software and service solution (i.e., what is most important to customers or users considering all trade-offs). These are the marketplace’s advantages marketed broadly to draw in more users and customers. These were considered value propositions of the marketplace that could be further marketed.
8. The marketplace is most often used for the exploration phase: when a need is identified and solutions are sought.
Over 7 in 10 respondents stated they used the marketplace for this exploration, which was the most common selection. It was followed by the consideration phase (62%), the decision phase (55%), and the idea generation phase (52%).
9. Annual licenses were the most preferred payment method for cloud computing software and services.
Over half (59%) of all respondents indicated a preference for annual licenses.
It was more than double any other payment method tested in the survey, including pay as you go (PAYG) (21%), contracts (from hourly to multi-year) (13%), private offers (5%), and consulting partner private offers (CPPO) (3%).
10. About half of the respondents completed a private offer on the marketplace, meeting expectations for nearly all.
Just under half (48%) stated they had completed a private offer on the marketplace.
A follow-up question was asked to understand whether experience met expectations or not on a 1-5 scale where 5 fully met expectations.
Nearly all respondents (94%) who completed a private offer on the marketplace stated it met expectations (4 or 5 on the 1-5 scale).
Another 5% rated it a 3, while only 1% rated it a 2. No respondents reported it did not meet expectations at all (1).
11. About half of the respondents stated COVID-19 had impacted their organization’s IT software and solutions spending.
Most commonly, ITDMs reported no change in spending (51%). Another 22% stated there was less spending, and 27% reported there was more spending.
Study Highlights
The survey included 41 questions and took an average of 15-minutes to complete. A total of 500 responses were collected from the targeted and qualified ITDM audience. Additional responses were removed which did not meet the strict Drive Research data quality controls.
The systematic process includes the following steps:
Reach out to Drive Research with details on your objectives, target audience, and timeline.
Drive Research creates a proposal with our recommended approach and investment.
The full launch of the survey and data collection with data quality checks.
Closing of fieldwork and launch of the online portal of results.
Analysis and creation of presentation of the results with data visualizations.
60-minute debrief of the findings and Q&A with the client team.
Sharing the final deliverables for the project, including the raw data, portals, and the report.
Contact Drive Research
Drive Research is a global market research firm located in the U.S. We work with software, SaaS, and tech companies to assess user satisfaction, user experience, marketing messaging, concept testing, ROI, and brand equity.
Our firm can reach some of the most challenging C-level executives, VPs, directors, managers, users, and analysts within the B2B space through our outstanding partner network.
We analyze more than data—we also track how our site is used to improve your experience. Cookies help us understand what’s working so we can deliver the most relevant insights. Click “Accept” to enable full functionality.
Functional
Always active
The technical storage or access is strictly necessary for the legitimate purpose of enabling the use of a specific service explicitly requested by the subscriber or user, or for the sole purpose of carrying out the transmission of a communication over an electronic communications network.
Preferences
The technical storage or access is necessary for the legitimate purpose of storing preferences that are not requested by the subscriber or user.
Statistics
The technical storage or access that is used exclusively for statistical purposes.The technical storage or access that is used exclusively for anonymous statistical purposes. Without a subpoena, voluntary compliance on the part of your Internet Service Provider, or additional records from a third party, information stored or retrieved for this purpose alone cannot usually be used to identify you.
Marketing
The technical storage or access is required to create user profiles to send advertising, or to track the user on a website or across several websites for similar marketing purposes.