In today’s rapidly evolving business landscape, staying ahead of the competition requires more than just a great product or service. It demands a deep understanding of the market, consumer behavior, and emerging trends. This is where the market research process becomes invaluable. In this blog post, we will delve more into market research and explore...
There is never a wrong time to do market research. However, most research projects are birthed because a company or organization is at a crossroads. Whether you’re a startup or Fortune 500 company, you’ll have critical decisions to make. This blog will detail common market research examples and how our clients have used them to...
Understanding the factors that drive consumer behavior is vital for any organization aiming to gain a competitive edge.
And market research, as a powerful tool, plays a crucial role in deciphering the intricate dynamics of consumer preferences and decision-making processes.
Within the realm of market research, one approach that holds immense value is key driver analysis.
By delving into the underlying motivations behind consumer choices, key driver analysis unveils the crucial factors that significantly influence customer satisfaction, loyalty, and purchase decisions.
In this blog, our online survey agency dives deeper into key driver analysis, examining its significance and uses in extracting actionable insights from vast amounts of data.
Interested in using key driver analysis? Contact our market research company for help.
Broadly speaking, key driver analysis is a statistical technique that determines the relative importance of assorted variables in predicting an outcome variable.
Within market research, driver analysis is often used to understand what aspects of the customer experience are the largest contributors to a positive interaction.
But what exactly drives this? The predictor variables that have the strongest relationship with the overall performance metric are what we refer to as the “key drivers.”
A main key driver analysis benefit is that it ultimately instills confidence in where an organization ought to focus its resources and efforts.
The outputs from this are a great example of derived importance.
How to Build a Key Driver Analysis
To conduct a successful analysis, you must first ensure you have multiple independent variables and a dependent variable in mind.
Once you have determined these variables, building a key driver analysis includes the following steps:
Data collection
Analysis
Mapping the results
Let’s dive into each step further.
Step 1. Data Collection
The independent variables, or predictor variables, will typically consist of attributes or touchpoints that would impact your customer experience.
The dependent variable, or outcome variable, may be an overall measure of customer happiness in some form. The goal is to understand how related the independent variables are to the performance of the dependent variable.
The easiest way to collect this data is through an online survey.
An online survey company can offer you an effective way to reach your audience and assemble the right inputs for a proper key driver analysis.
What’s more, they’re a great way to find action-driven data to boost your organization’s business strategy.
Step 2. Beginning the Analysis
Once you have gathered your data, you can transition into the analysis. A standard way of conducting an analysis is via multiple linear regression analyses.
This process first identifies the correlation of each predictor variable with the outcome variable.
To get a clearer picture of the impact of each predictor, the regression will review all the correlations and calculate a metric for relative importance that sums to 100%.
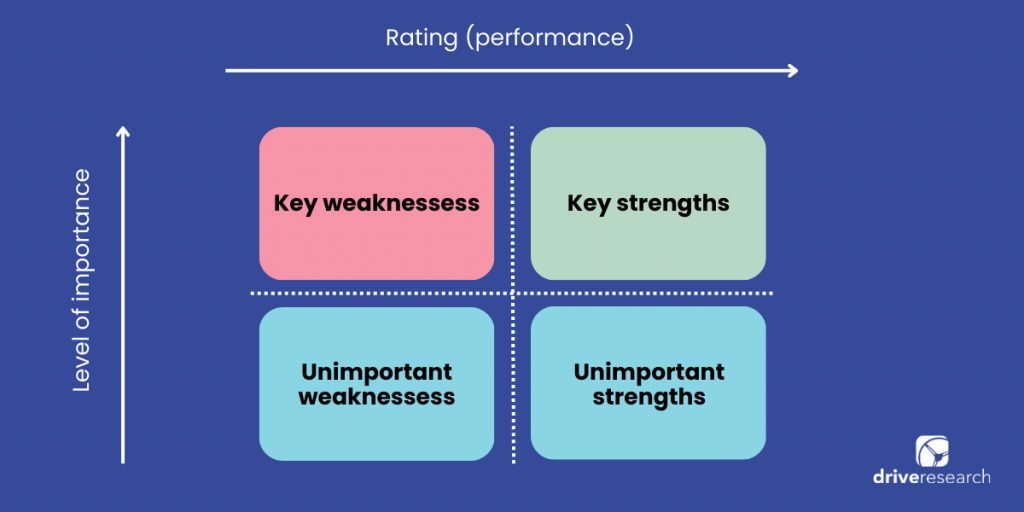
When the regression is complete, a great way to visualize the results is through a quadrant map.
Step 3. Mapping the Results
This matrix often plots your data with the outcome variable on the Y-axis and the relative importance scores on the X-axis.
Predictor variables that result in the top-right quadrant (more positive outcome, high relative importance) can be considered your key drivers.
A common problem worth noting in key driver analysis is multicollinearity.
Under this circumstance, predictor variables have a high degree of correlation with each other. This means there is a large overlap in the variance between predictor variables, causing the driver analysis to ignore critical information.
With less unique variance, there is a good chance the results may not tell the full story of what drivers are important.
Thankfully, there are various solutions to improve a key driver analysis that is subject to multicollinearity.
Some of these solutions include:
Running a factor analysis beforehand
Ridge regression
Shapley regression
Averaging over orderings (AOO)
Johnson’s relative importance weights
Random Forests
For further context, Sawtooth Software explains how exactly some of these approaches achieve a better result here.
Key Driver Analysis Example
You need to ask the right questions in a survey to run a robust driver analysis.
Let’s talk about predictor variables. The predictor variables are usually data from rating scales in a survey.
A best practice for collecting this data is maintaining a consistent scale range for all the predictor variables.
A 1-to-5 or 1-to-7 scale should do nicely. This should result in data that is both simple to work with and understand on the back end.
If the end goal is to make business decisions based on the results, also take time to make the predictor variables actionable in your survey.
For example, let’s say that satisfaction with the weather on the day of purchase is closely correlated to overall satisfaction.
This information is not particularly useful for a business to improve its strategy. Aligning your predictor variables to aspects of the customer experience that can be directly influenced by business decisions will make the results go much further.
The number of predictor variables doesn’t necessarily have a hard limit beyond the sample size, but stay mindful of potential multicollinearity issues. Distinct, mutually exclusive variables will perform best in an analysis.
Examples of common predictor variables include:
Cost/price
Quality
Customer service
Delivery/timeliness
Availability
Similar to predictor variables, the outcome variable also usually comes in the form of a rating scale question.
Standard metrics include:
Customer satisfaction
Intent to purchase
Likelihood to recommend (Net Promoter Score)
Likelihood to repurchase
It is imperative to remember the outcome variable is a representation of the overall customer experience – not satisfied with any single element.
When to Use Key Driver Analysis
So, how do you know when this type of analysis is a good fit for your needs?
Here are a few examples of when our online survey company recommends using key driver analysis.
Identifying what is most important to customers
A great application of key driver analysis is when you have a general idea of what influences your customer experience but lack an understanding of what is most important.
That’s because key driver analysis techniques will help you narrow down the aspects that are most likely to move the needle on customer happiness.
Identifying what customers are not telling you
Another related scenario for using the analysis is if you believe your customers aren’t telling the full story when asked point-blank what matters most.
This method takes an indirect approach to identify the underlying drivers with respect to overall satisfaction. This may overcome the challenge of customers whose actions don’t necessarily match their words.
Perhaps you are experiencing remarkable customer satisfaction and want to know the reasons behind the positive outcomes.
Key driver analysis will provide insight as to what factors are driving that success.
On the flip side, let’s say your customer loyalty is suffering as of late. You can just as easily use the analysis to pinpoint the opportunity areas to retain more customers.
Contact Our Full-Service Market Research Company
Interested in learning more about this important market research technique? You’re in the right place.
Drive Research is a national market research company. Our team is ready to assist you with conducting a key driver analysis for your brand or business to get to the bottom of what drives positive customer experiences.
We analyze more than data—we also track how our site is used to improve your experience. Cookies help us understand what’s working so we can deliver the most relevant insights. Click “Accept” to enable full functionality.
Functional
Always active
The technical storage or access is strictly necessary for the legitimate purpose of enabling the use of a specific service explicitly requested by the subscriber or user, or for the sole purpose of carrying out the transmission of a communication over an electronic communications network.
Preferences
The technical storage or access is necessary for the legitimate purpose of storing preferences that are not requested by the subscriber or user.
Statistics
The technical storage or access that is used exclusively for statistical purposes.The technical storage or access that is used exclusively for anonymous statistical purposes. Without a subpoena, voluntary compliance on the part of your Internet Service Provider, or additional records from a third party, information stored or retrieved for this purpose alone cannot usually be used to identify you.
Marketing
The technical storage or access is required to create user profiles to send advertising, or to track the user on a website or across several websites for similar marketing purposes.