In today’s rapidly evolving business landscape, staying ahead of the competition requires more than just a great product or service. It demands a deep understanding of the market, consumer behavior, and emerging trends. This is where the market research process becomes invaluable. In this blog post, we will delve more into market research and explore...
There is never a wrong time to do market research. However, most research projects are birthed because a company or organization is at a crossroads. Whether you’re a startup or Fortune 500 company, you’ll have critical decisions to make. This blog will detail common market research examples and how our clients have used them to...
2025 Black Friday Statistics & Trends: Insights from 1,200+ Shoppers
Emily Rodgers
Black Friday has grown far beyond a single day of deals, evolving into a shopping season that sets the tone for holiday retail.
From online carts filling up weeks in advance to in-store lines still wrapping around buildings, it remains one of the biggest events of the year for both shoppers and businesses.
To better understand how shoppers are approaching the big day, we surveyed more than 1,200 consumers about their 2025 Black Friday plans, habits, and spending.
This marks the seventh consecutive year we’ve conducted the holiday shopping study, giving us a unique look at how trends have shifted over time, and how they may continue to evolve this holiday shopping season.
Top Black Friday Statistics for 2025:
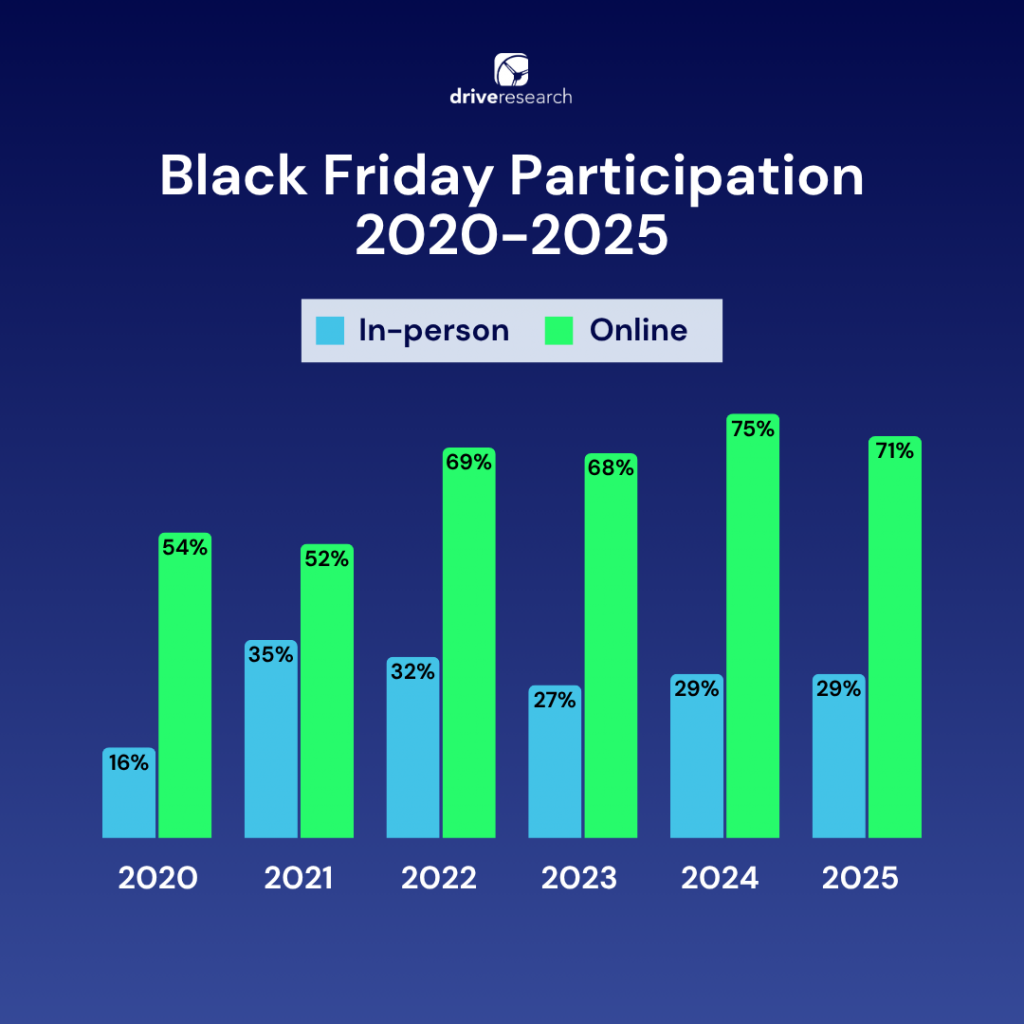
71% of people will shop online this Black Friday, while 29% will shop in-person
Nearly 1 in 4 Black Friday shoppers (24%) will spend $1000 or more on holiday shopping
Rising costs of living (70%) and groceries (57%) are top reasons Black Friday shoppers plan to cut back on holiday spending in 2025
1 in 3 in-person Black Friday shoppers will start shopping in-store on Thanksgiving Day 2025 (33%)
Most people will shop in-person at Walmart (71%) and Target (56%) on Black Friday
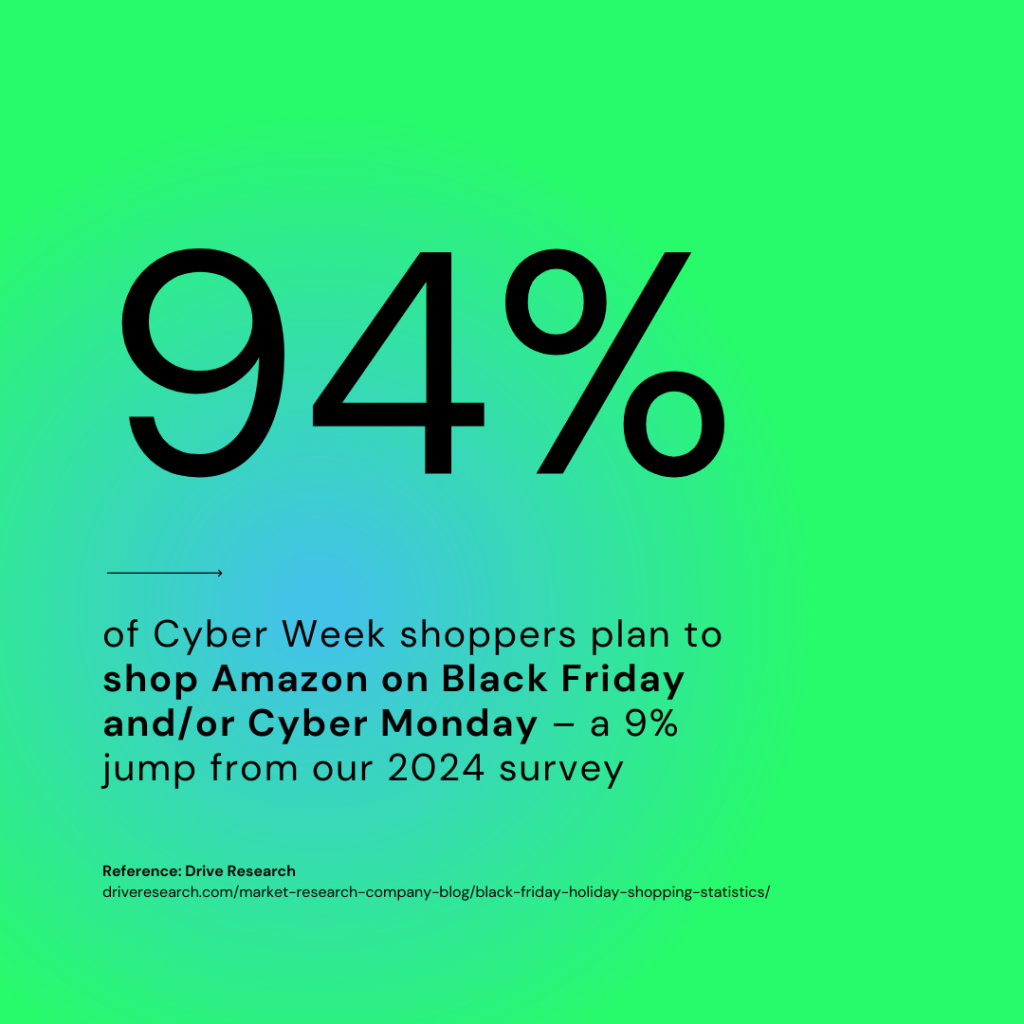
Amazon is the go-to destination for Cyber Week in 2025, with 94% of shoppers planning to buy there
Download the 2025 Holiday Shopping Report
"*" indicates required fields
Black Friday Shopping Participation in 2025
88% plan to shop during Cyber Week 2025
71% of people will shop online this Black Friday, while 29% will shop in-person
People mostly shop on Black Friday to take advantage of special discounts (80%) and to buy items they’ve been wanting at a lower price (67%)
Not liking crowds (52%) is the biggest reason people will not shop on Black Friday
Over 1 in 10 people agree Cyber Week is a scam (12%)
Black Friday Spending
Nearly 1 in 4 Black Friday shoppers (24%) will spend $1000 or more on holiday shopping
Most 2025 Black Friday shoppers (76%) will spend the same or less money on holiday shopping compared to 2024
Rising costs of living (70%), rising costs of groceries (57%), and high inflation (54%) are among the top reasons Black Friday shoppers will spend less money on holiday shopping in 2025
To save for the holidays, Black Friday shoppers will set aside a specific amount of money each month (39%) and/or wait for holiday bonuses for extra income to fund shopping (33%)
Over 1 in 10 Black Friday shoppers have part of their pay go automatically into a holiday fund
Top Product Categories for Black Friday Shoppers
Clothing and accessories is the top purchase category for both in-person Black Friday shopping (80%) and online (77%)
Most Black Friday shoppers plan to purchase electronics either in-person (70%) or online (69%)
More people will purchase household appliances in-person on Black Friday (38%) than online (30%)
Over 1 in 3 people will purchase gift cards on Black Friday whether it be in-store (37%) or online (36%)
Download the 2025 Holiday Shopping Report
"*" indicates required fields
Online vs. In-Store Shopping Preferences
In 2025, nearly every Cyber Week shopper (94%) plans to shop Amazonon Black Friday and/or Cyber Monday – a 9% jump from our 2024 survey
1 in 3 in-person Black Friday shoppers will start shopping in-store on Thanksgiving Day 2025 (33%)
30% of in-person Black Friday shoppers will start shopping in-store on Friday, November 28th 2025 between 5 AM to 10 AM
Most people will shop in-person at Walmart (71%) and Target (56%) on Black Friday
29% of shoppers will wait over two hours in line to enter a store on Black Friday
42% of Black Friday shoppers will wait 30 minutes to an hour in checkout lines
More than half of online Black Friday shoppers (53%) say they prefer using a smartphone, compared to 37% who shop on a desktop or laptop
Those who shop for Black Friday on a smartphone prefer to do so through a retailer’s app (27%) or website browser (26%)
Influence of Promotions and Discounts
Special discounts (80%) is the top reason people plan to shop on Black Friday
Free shipping (78%) and promotions/sales (77%) are the most important factors for choosing where people shop on Black Friday
Over half of Black Friday shoppers also cite availability of products (64%) and fast shipping times (50%) as factors for where they choose to shop during Cyber Week
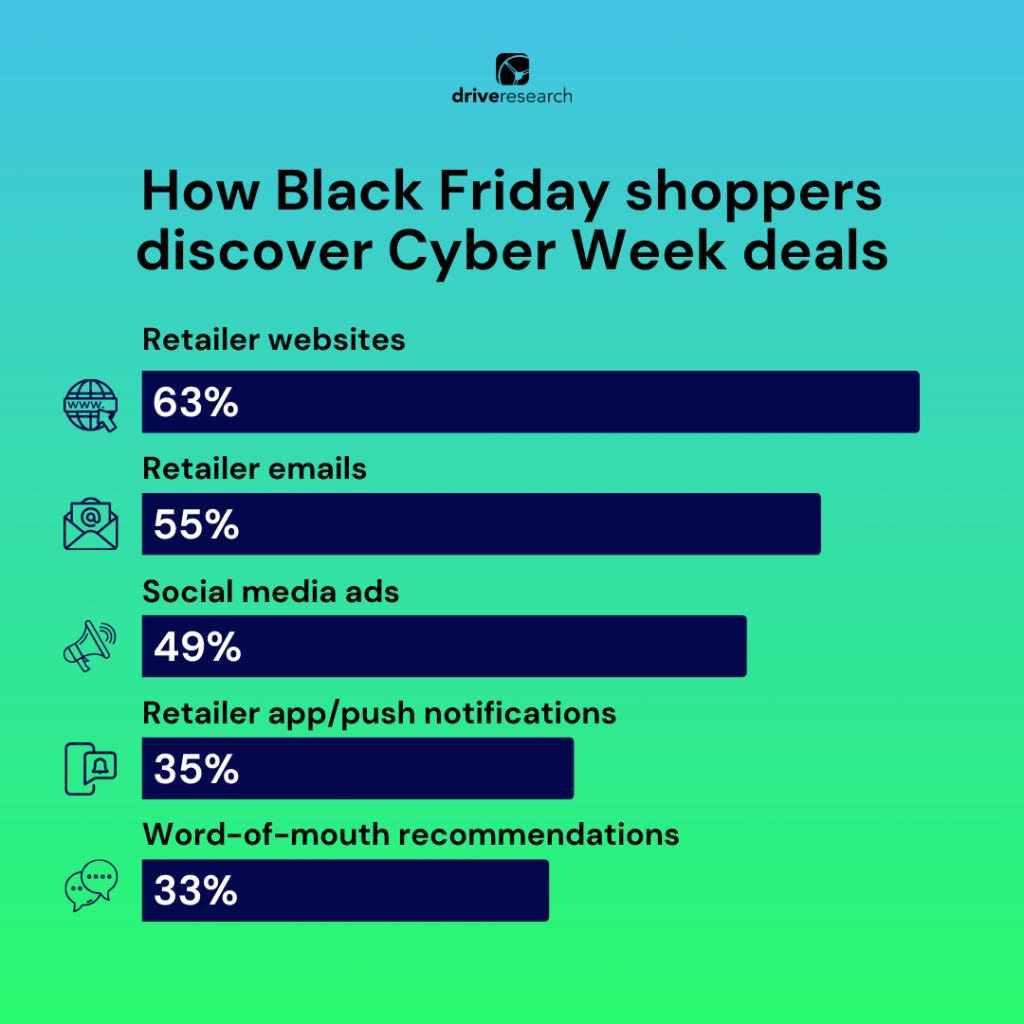
For Black Friday shoppers, they mostly discover Cyber Week deals through retailer websites (63%) and promotional emails (55%).
Nearly half of Black Friday shoppers (49%) cite retailer promotional social media ads for how they discover Cyber Week deals
AI’s Impact on Black Friday
81% of Black Friday shoppers would consider using AI to help with holiday shopping
Most Black Friday shoppers would consider using AI to find the lowest prices across multiple sites (65%) and help track price drops of coupons (55%) when holiday shopping
Close to half of Black Friday shoppers (46%) would use AI to compare product reviews and ratings when holiday shopping
Over a third of Cyber Monday shoppers say they would consider using AI to help them come up with gift ideas for specific people (36%) and to create a shopping list or gift guide (33%)
1 in 10 Black Friday shoppers (10%) discover Cyber Week deals through AI tools such as ChatGPT and Gemini
Nearly 1 in 10 Black Friday shoppers (9%) report AI-powered shopping assistance as a factor for choosing where they shop during Cyber Week
In 2025, 88% of consumers plan to shop during Cyber Week, up from 84% in 2024. While participation was already high, this increase shows the continued importance of Cyber Week in holiday shopping traditions.
Online Shopping Maintains Its Lead
This year, 71% of shoppers will buy online compared to 29% in-store. The share of online shopping has remained strong, though 2024 also saw a slight rebound in in-person participation (29%, up from 27% in 2023). The trend suggests that while digital dominates, in-store shopping is not disappearing.
Amazon’s Grip Tightens Again
Amazon grew from 85% of Cyber Week shoppers in 2024 to 94% in 2025—a significant jump that signals its dominance as the go-to retailer. Walmart and Target remain top choices in-store, but no online retailer rivals Amazon’s reach.
Spending Stays Cautious
In both 2024 and 2025, about one in four shoppers expect to spend $1,000 or more during the holidays. However, the majority continue to say they will spend the same or less than the previous year. Rising costs of living, groceries, and inflation remain the leading reasons for reduced spending, showing consistency year over year.
Motivations for Shopping Are Stable
Special discounts remain the top draw (80% in 2025 vs. 87% in 2024). Many shoppers also continue to see Cyber Week as a chance to buy items they’ve been waiting to purchase at lower prices.
Perceptions of Cyber Week
In 2025, 12% of consumers agree Cyber Week is a “scam,” up slightly from 9% in 2024. While most shoppers embrace the event, skepticism is slowly growing.
Shopping Habits & Timing One-third of in-person shoppers in 2025 plan to start on Thanksgiving Day, consistent with 2024. Waiting in lines and navigating crowds remain a part of the tradition, but convenience continues to push many toward smartphones and retailer apps for online purchases.
Figures in our holiday shopping report are drawn from an online survey conducted by Drive Research, a global market research company, to better understand consumers’ holiday shopping preferences and purchasing behaviors.
The survey took an average of 7 minutes to complete and included 24 questions. The survey received 1,249 responses. Fieldwork for the survey began on September 12 and lasted until September 19, 2025.
With a probabilistic sample, a total of 1,249 responses at the 95% confidence level offers a 3% margin of error. If the survey were conducted with another random pool of respondents, the results would yield within +3% or -3% of the stated totals in the reports.
Download Our 2025 Holiday Shopping Report
Hundreds of new statistics and insights to help retailers, eCommerce sites, and agencies learn practical and relevant information to improve decision-making.
We analyze more than data—we also track how our site is used to improve your experience. Cookies help us understand what’s working so we can deliver the most relevant insights. Click “Accept” to enable full functionality.
Functional
Always active
The technical storage or access is strictly necessary for the legitimate purpose of enabling the use of a specific service explicitly requested by the subscriber or user, or for the sole purpose of carrying out the transmission of a communication over an electronic communications network.
Preferences
The technical storage or access is necessary for the legitimate purpose of storing preferences that are not requested by the subscriber or user.
Statistics
The technical storage or access that is used exclusively for statistical purposes.The technical storage or access that is used exclusively for anonymous statistical purposes. Without a subpoena, voluntary compliance on the part of your Internet Service Provider, or additional records from a third party, information stored or retrieved for this purpose alone cannot usually be used to identify you.
Marketing
The technical storage or access is required to create user profiles to send advertising, or to track the user on a website or across several websites for similar marketing purposes.