In today’s rapidly evolving business landscape, staying ahead of the competition requires more than just a great product or service. It demands a deep understanding of the market, consumer behavior, and emerging trends. This is where the market research process becomes invaluable. In this blog post, we will delve more into market research and explore...
There is never a wrong time to do market research. However, most research projects are birthed because a company or organization is at a crossroads. Whether you’re a startup or Fortune 500 company, you’ll have critical decisions to make. This blog will detail common market research examples and how our clients have used them to...
Structural Equation Modeling in Market Research: A Practical Guide
Tim Gell
Market research often goes beyond measuring surface-level metrics. Businesses don’t just want to know what customers think, they want to understand why. Structural equation modeling or SEM is a statistical method designed to uncover those deeper connections.
By analyzing how multiple factors interact, SEM helps explain outcomes like loyalty, purchase intent, or satisfaction. Instead of looking at each variable in isolation, it shows how they work together.
At Drive Research, we’ve seen SEM help brands identify barriers in the customer journey, prioritize improvements, and focus strategies where they’ll have the most impact. In this guide, we’ll walk through what SEM is, when to use it, how it works, and share a case study with one of our clients.
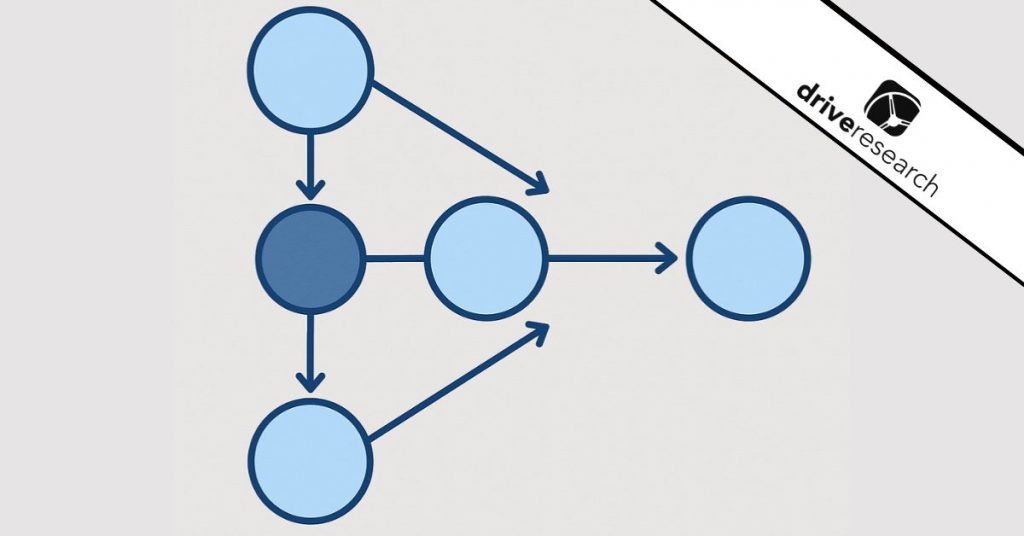
Structural equation modeling (SEM) is a statistical framework for analyzing complex relationships between variables. Think of it as taking a messy web of customer data and turning it into a clear diagram that shows how different factors connect and influence one another.
SEM combines elements of two popular techniques you may already know:
Factor analysis, which groups related variables together into broader themes.
Regression analysis, which tests how strongly one variable predicts another.
By blending these approaches, SEM allows researchers to look at both direct and indirect effects.
For instance, customer service quality might directly influence satisfaction, but it could also indirectly influence brand loyalty by first shaping trust. SEM captures both pathways in a single model.
Structural Equation Modeling Example
To make this less complex, let’s look at a practical example. Imagine a retail brand wants to understand what drives repeat purchases. So they collect survey data from customers on several factors: product quality, website usability, customer service, trust in the brand, satisfaction, and loyalty.
If they ran a simple regression, they might find that product quality and satisfaction both predict loyalty. Useful, but incomplete.
What SEM reveals is more nuanced:
Product quality influences satisfaction, which then drives loyalty.
Customer service shapes trust, which also impacts satisfaction.
Website usability indirectly contributes to loyalty through its effect on trust.
This layered view gives the retailer a clearer roadmap. Instead of guessing which improvement will matter most, SEM highlights where interventions will have the biggest ripple effects.
When to Use Structural Equation Modeling
Not every research question requires this level of advanced analytics, but when complexity is high, it’s often the best approach.
Here are a few situations where SEM shines:
Multiple overlapping influences. Customer loyalty isn’t shaped by just one factor. SEM can map how product quality, service, pricing, and reputation interact.
Testing cause-and-effect hypotheses. If you suspect “A impacts B through C,” this type of analysis can confirm or challenge that assumption.
Identifying hidden themes. Structural equation modeling groups related barriers or drivers together, making insights more actionable.
Strategic decision-making. When leadership needs clear priorities, this analysis can highlight which levers create the biggest impact.
For example, in employee engagement research, SEM might reveal that recognition improves morale, which then improves retention. While in higher education, it could show how campus resources influence satisfaction through perceptions of support.
By clarifying both direct and indirect effects, SEM helps organizations avoid tunnel vision and invest where it truly counts.
Not sure if this method is right for your project? Ask our team.
How to Do Structural Equation Modeling (And Get It Right)
The process can seem intimidating at first, but it follows a logical series of steps. Here’s a closer look at how it works in practice.
We’ll also include our “pro tips” throughout each stage to highlight best practices that make the analysis more reliable and the results more actionable.
1. Define Constructs and Hypotheses
Before any data is collected, researchers outline the “constructs” they want to measure such as trust, satisfaction, loyalty, or perceived value. These are often abstract concepts that can’t be observed directly, so they’re defined through measurable survey questions.
At this stage, it’s also important to form hypotheses about how constructs connect. For instance:
Trust increases satisfaction.
Satisfaction drives loyalty.
Product quality strengthens trust.
Pro tip: Keep the model grounded in real business questions. Overcomplicating it with too many constructs or theoretical links can make results harder to interpret and apply.
2. Design the Survey or Data Collection
Next, researchers design survey questions (or use existing data) that capture the constructs. Because these ideas are abstract, each one usually requires multiple items to measure.
For example, “trust” might be assessed through statements like “I believe this brand keeps its promises” or “I feel confident this company acts in my best interest.”
Questions are often asked on a 5- or 7-point rating scale. That’s because using multiple items for each construct helps ensure reliability and gives the model enough data to identify patterns.
Pro tip: Avoid relying on single questions to measure complex ideas. Multiple indicators not only provide a more accurate picture but also strengthen the validity of the model.
3. Choose the Right Software
Once data is collected, specialized software is needed to run the analysis. Common tools include AMOS, LISREL, R (with packages like lavaan), or Mplus.
Each platform has its strengths, but the goal is the same: estimate the relationships between constructs and determine how well the model fits the data.
At Drive Research, we pair these tools with tailored survey design so the analysis aligns directly with business objectives, not just statistical theory.
Pro tip: Don’t just rely on software defaults. Fit indices like RMSEA, CFI, and Chi-square should all be reviewed to ensure the model accurately reflects the data.
4. Build and Test the Model
This is where the math happens. The software estimates the paths (arrows) between constructs and variables, showing which connections are strong, weak, or insignificant. Researchers then test how well the data supports the proposed structure.
If the model doesn’t fit well, adjustments are made by combining similar constructs, removing weak links, or re-examining survey items.
Pro tip: Use a large enough sample size. Because SEM estimates many parameters, models are more stable and reliable with robust sample sizes (often 400+ respondents).
5. Interpret Results and Translate into Action
Once a good fit is achieved, the real value comes in interpretation.
We recommend looking at both…
Direct effects (e.g., service quality → satisfaction)
This layered view shows not only what matters, but also how improvements cascade through the customer experience.
For example, if trust indirectly drives loyalty through satisfaction, the recommendation might be to invest in initiatives that build credibility and transparency.
Pro tip: Always connect results back to business strategy. A technically correct model means little unless it helps leaders prioritize actions that improve outcomes.
Let our market research experts turn complex data into clear strategies.
SEM Case Study: Understanding Barriers in Financial Services
The Challenge
Drive Research partnered with a major financial services company and its advertising agency to better understand the barriers preventing customers from choosing them at different stages of the purchase funnel.
The client already knew what drove customers to select them but lacked clarity on the obstacles standing in the way.
Key objectives included:
Identifying both perceptual and factual barriers.
Understanding how these barriers vary by funnel stage, purchase channel, and life stage.
Comparing the client to competitors to reveal gaps and differentiators.
The Solution
To meet these objectives, we recommended an online survey designed to support advanced modeling.
This method was selected because of its ability to:
Test hypotheses about the relationships between barriers.
Group correlated statements into themes.
Prioritize which barrier themes had the greatest impact on choice.
Respondents rated their agreement with up to 50 barrier statements depending on the funnel stage they were in. These 5-point scale ratings became the foundation for the model. The client and competitors were rotated into the design for a full market view.
The sample included U.S. consumers who had recently used or considered the client. Augments were added to ensure reliable sample sizes for key segments.
Our Approach
The process included several key steps:
Kickoff & Workshop: Alignment with the core client team on objectives, followed by a workshop to refine the barrier list.
Survey Design: Questionnaire developed to capture model-ready data, plus screening and demographic questions.
Programming & Testing: Survey programmed into our platform and thoroughly tested before launch.
Fieldwork: Online research panels were used to gather a representative mix of respondents.
Analysis & Reporting: The model was built to identify barrier themes and determine which mattered most.
The Results
The survey collected responses from 4,011 consumers, resulting in a margin of error of just ±1.5%. Three models were created to reflect different stages of the purchase funnel, each highlighting the barrier themes most impactful at that point.
The modeling allowed the client to combine and separate barrier statements, producing insights that were more actionable than a flat list of barriers.
While specific findings remain confidential, the results are being used to inform marketing, product, and communication strategies which gives the client a roadmap to attract and retain customers more effectively.
Ready to Explore SEM for Your Business?
Structural equation modeling is one of the most effective tools for turning complex customer data into clear, actionable insights. By revealing both direct and indirect relationships, it helps businesses understand why customers act the way they do and which levers to pull for maximum impact.
Whether you’re a data analyst looking to validate hypotheses, a customer insights professional mapping decision journeys, or a business leader setting strategy, this framework provides a way to go beyond surface-level metrics.
At Drive Research, we combine advanced analytics with custom survey design, robust fieldwork, and thoughtful reporting. The result: research you can trust to drive smarter decisions.
We analyze more than data—we also track how our site is used to improve your experience. Cookies help us understand what’s working so we can deliver the most relevant insights. Click “Accept” to enable full functionality.
Functional
Always active
The technical storage or access is strictly necessary for the legitimate purpose of enabling the use of a specific service explicitly requested by the subscriber or user, or for the sole purpose of carrying out the transmission of a communication over an electronic communications network.
Preferences
The technical storage or access is necessary for the legitimate purpose of storing preferences that are not requested by the subscriber or user.
Statistics
The technical storage or access that is used exclusively for statistical purposes.The technical storage or access that is used exclusively for anonymous statistical purposes. Without a subpoena, voluntary compliance on the part of your Internet Service Provider, or additional records from a third party, information stored or retrieved for this purpose alone cannot usually be used to identify you.
Marketing
The technical storage or access is required to create user profiles to send advertising, or to track the user on a website or across several websites for similar marketing purposes.