In today’s rapidly evolving business landscape, staying ahead of the competition requires more than just a great product or service. It demands a deep understanding of the market, consumer behavior, and emerging trends. This is where the market research process becomes invaluable. In this blog post, we will delve more into market research and explore...
There is never a wrong time to do market research. However, most research projects are birthed because a company or organization is at a crossroads. Whether you’re a startup or Fortune 500 company, you’ll have critical decisions to make. This blog will detail common market research examples and how our clients have used them to...
Grocery Store Statistics: Where, When, & How Much People Grocery Shop
Emily Rodgers
Across the U.S., there are 63,328 supermarkets and grocery store businesses. Each day they are filled with different types of people who have unique needs, preferences, budgets, and other buyer characteristics.
As consumer buying behaviors evolve, it’s important to stay up to date on where, when, and how much they grocery shop.
To help, our market research company surveyed over 1,000 consumers across the U.S. to look at the current landscape of grocery shoppers and how that’s evolved since our surveys in years past.
In this post, we’ll share some of our findings.
Top Grocery Store Shopping Statistics:
In 2024, consumers spend an average of $174 per grocery trip
Over half of consumers anticipate spending more on groceries in 2024 than 2023 (56%)
Dairy goods (82%), fresh produce (80%), and snack foods (76%) are among the top grocery items people purchase
74% of grocery shopping still happens in physical stores
Saturday from 10 a.m. to 1:59 p.m. is the most popular time to go grocery shopping
Use of grocery delivery servicesin 2024 have risen by 56% compared to 2022
Dairy goods (82%), fresh produce (80%), and snack foods (76%) are among the top grocery items people purchase
Dairy goods and fresh produce are staples in many diets, offering essential nutrients, freshness, and convenience. Additionally, snack foods cater to cravings and provide quick energy boosts, making them popular choices for consumers.
The most common grocery store items people buy include:
Larger household sizes are more likely to purchase snack foods than smaller HH sizes
For households with five or more people living in the home, snack foods such as chips, cookies, crackers, and dried fruit was the second highest purchased grocery item (85%) behind fresh produce (88%).
Comparatively, households with 1-4 people were more likely to report dairy goods and fresh produce as items they most typically purchase at the grocery store.
Here’s a closer look at how different household sizes have varying grocery items they are most likely to purchase.
HH size of 1
Dairy goods: 78%
Fresh produce: 73%
Frozen goods: 67%
HH Size of 2
Dairy goods: 87%
Fresh produce: 83%
Snack foods: 79%
HH Size of 3-4
Dairy goods: 79%
Fresh produce: 77%
Snack foods: 77%
HH Size of 5+
Fresh produce: 88%
Snack foods: 85%
Dairy goods: 84%
How Much People Spend on Groceries
On average, people spend $174 on groceries per trip to the grocery store in 2024
Have you ever gone to Target just for peanut butter and left spending $200 on things you probably don’t need? Same.
I commend anyone who doesn’t deviate from their grocery list.
According to our grocery store shopping survey, on average consumers spend $174 on groceries per shopping trip. This is a 12% increase from the average spent per grocery shopping trip in 2022.
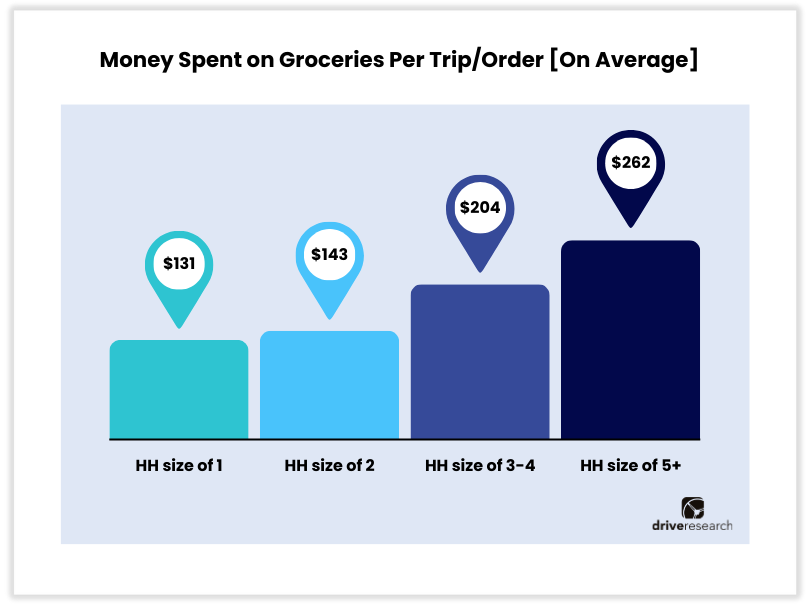
Larger household sizes result in higher grocery shopping bills
Unsurprisingly, with more mouths to feed, families of 3+ people are paying more than the average $174 per grocery shopping trip.
The average dollar amount spent per grocery shopping trip varies among household sizes:
HH size of 1: $131
HH Size of 2: $143
HH Size of 3-4: $204
HH Size of 5+: $262
Over half of consumers anticipate spending more on groceries in 2024 than 2023 (56%)
The statistic suggests a significant shift in consumer behavior towards increased spending on groceries, indicating potential factors such as inflation, changes in dietary habits, or economic conditions. This trend could impact both retailers and consumers, with implications for pricing strategies, product demand, and household budgets.
39% of people spend over their grocery shopping budget each month
This finding highlights a notable challenge for many consumers in adhering to their grocery budgets. The U.S. Department of Agriculture predicts all food prices are expected to increase 2.5% and food-at-home prices are predicted to go up 1.6% in 2024. Therefore, it is no surprise that nearly 40% of people are spending more than their allotted amount on groceries each month.
Only 7% of people spend under their grocery shopping budget each month
In this economy, there seems to be a rarity of underspending on groceries among consumers, suggesting that most individuals consistently allocate their entire budget or exceed it when shopping for groceries.
Grocery shoppers report low everyday pricing (71%) is a more valuable offer than weekly ad specials (51%) or digital coupons (45%)
The importance of consistent everyday pricing in attracting and retaining grocery store customers cannot be understated.
According to our data, by prioritizing competitive everyday prices over sporadic specials or digital coupons, stores can build trust and loyalty among shoppers who appreciate transparent and reliable pricing.
The following offers are what grocery shoppers report are most valuable for grocery stores to provide:
Low everyday pricing: 71%
Weekly ad specials: 51%
Digital coupons: 45%
Loyalty program point accumulation: 43%
Gas/fuel discounts: 31%
Store credit card cashback: 24%
Delivery/curbside discounts: 17%
Get access to our State of Grocery Shopping Report
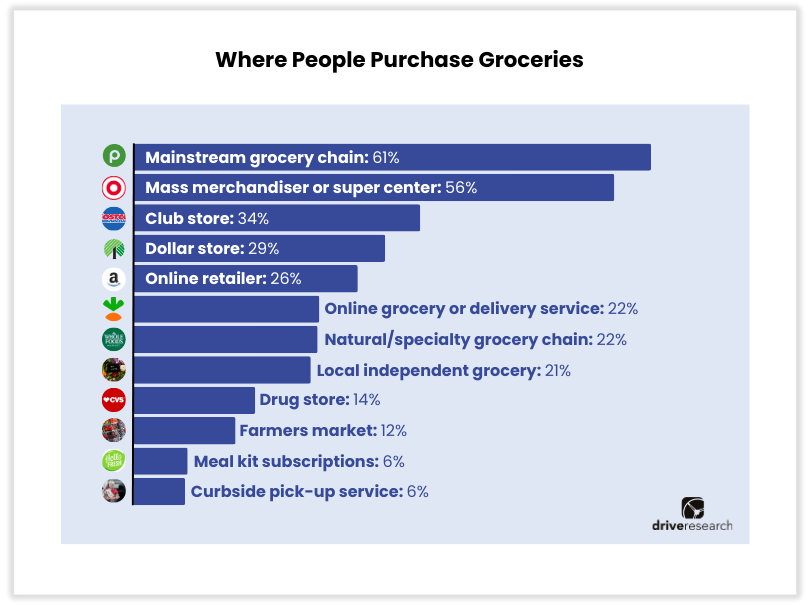
Most people grocery shop at a mainstream grocery chain (61%) or a supercenter (56%)
It is likely many shoppers choose mainstream grocery chains such as Publix and Safeway or supercenters such as Target and Walmart due to convenience, affordability, and variety.
These establishments typically offer a wide range of products at competitive prices and are often conveniently located, making them preferred choices for the majority of shoppers.
The most common grocery store locations where people shop include:
Consumers still mostly shop for groceries in-person, at a physical grocery store
Our survey asked respondents in a typical month, what percent of their grocery shopping was completed in-person, by delivery, through curbside pickup, or other channels. Here are the averages.
74% of the time, grocery shopping occurs in a physical store
25% of the time, grocery shopping is done through a delivery service/app
12% of the time, grocery shopping is done through a curbside or pickup service/app
8% of the time, grocery shopping is done through other ways
Use of grocery delivery services in 2024 have risen by 56% compared to 2022
While most shoppers are still grocery shopping in-person, our retail market research company found there was a notable increase in the use of delivery and curbside pickup services from 2022 to 2024.
Usage of grocery delivery services: 16% in 2022 ➡️ 25% in 2024 (+56%)
Usage of grocery curbside or pickup services: 6% in 2022 ➡️ 12% in 2024 (+100%)
This shift reflects a growing preference for convenient and contactless shopping experiences among consumers during this period.
On average, people shop at 2 grocery stores per week
Whether it be a physical store or a delivery/pickup service, the average American shops at two grocery stores for their weekly grocery needs. This might be to maximize cost savings, access a broader range of products, and take advantage of different promotions or discounts offered by each store.
Price (72%) and location (59%) are the most influential factors for choosing a grocery store
According to our survey, price (72%), location (59%), and quality of products (57%) are most important for grocery shoppers when choosing their preferred store. This was not that big of a surprise to us because any market research study we’ve done, whether it be with grocery shoppers or just general consumers, price, location, and quality is always the top factor.
Most influential factors for choosing a grocery store include:
Prices: 72%
Location: 59%
Quality of products: 57%
Variety of products: 54%
Store cleanliness: 36%
Loyalty rewards or membership benefits: 32%
Customer service quality and friendliness of staff: 29%
Store hours: 27%
Store crowdedness: 20%
Availability of self-checkout options: 18%
Availability of specialty items (e.g., vegan, kosher): 15%
Offers curbside pickup: 12%
Offers delivery: 12%
Personal recommendations from friends or family: 11%
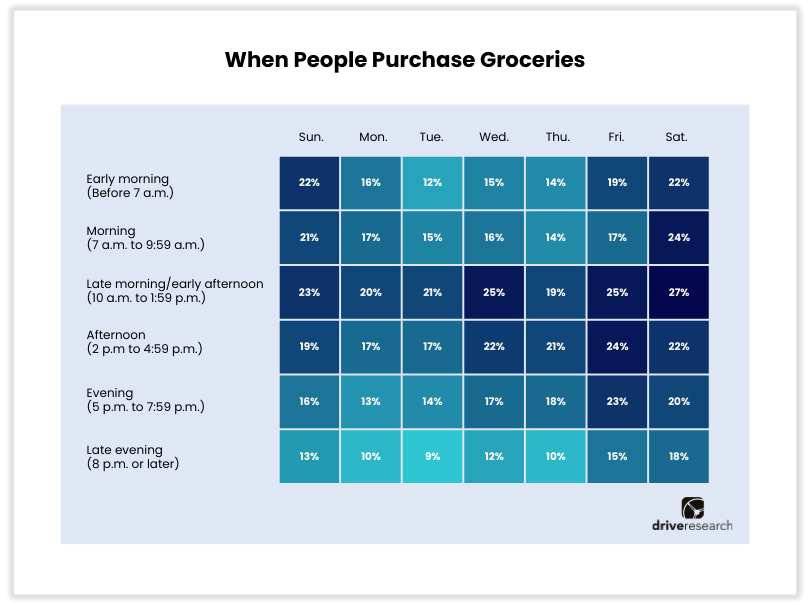
When People Go to Grocery Stores
Saturday from 10 a.m. to 1:59 p.m. is the most popular time to go grocery shopping
Knowing that Saturday from 10 a.m. to 1:59 p.m. is the peak time for grocery shopping enables stores to optimize their staffing and inventory management during these hours. They can ensure adequate staffing levels to handle the influx of shoppers and strategically plan promotions or special offers to capitalize on the busiest times, enhancing customer experience and maximizing sales potential.
Tuesday at 8 p.m. or later is the least popular time to go grocery shopping
Recognizing Tuesday evenings, particularly after 8 p.m., as the least popular time for grocery shopping allows stores to adjust their operational schedules accordingly. They can optimize staffing levels and conduct maintenance or restocking activities during these quieter periods, ensuring efficient use of resources while minimizing inconvenience for both staff and customers.
Most people spend less than 44 minutes grocery shopping per trip (74%)
From our experience conducting market research with grocery shoppers, we have found many people try to minimize time spent on errands, allowing them to balance other commitments and responsibilities effectively.
Perhaps that’s why nearly 3 in 4 people spend less than 44 minutes in a grocery store when shopping for groceries. Though, the amount of time people spend in a grocery store during an average trip varies.
Here’s what our survey found:
35% of people spend less than 30 minutes grocery shopping per trip
39% of people spend 30 to 44 minutes grocery shopping per trip
27% of people spend 45+ minutes grocery shopping per trip
In 2024, consumers report making 6 grocery store trips or orders per month – down from the average 8 trips in 2022
Perhaps the most frustrating feeling is going grocery shopping, loading and unloading bags from your car, and unpacking them in your house just to realize you forgot to buy a crucial food or drink item.
Back to the grocery store you go. ?
Whether it be for weekly groceries or last-minute items, people go to the grocery store or make an online grocery order an average of 6 times per month.
Several factors could contribute to the decrease in the average number of grocery trips per month from 8 to 6. One potential reason is the increased adoption of online grocery ordering and delivery services, which allow people to consolidate their shopping into fewer trips.
Uncover more retail consumer insights in our State of Grocery Shopping Report
How often does the average person go grocery shopping?
The average person makes 6 grocery store trips or orders per month. Additionally, on average, people shop at 2 grocery stores per week.
What percent of people shop at grocery stores?
Consumers still mostly shop for groceries in-person, at a physical grocery store. On average, 74% of the time grocery shopping occurs in a physical store while 25% of the time, grocery shopping is done through a delivery service/app.
What is the most purchased grocery item in the US?
Dairy goods such as milk, butter, cheese, eggs, yogurt are the most purchased grocery item with 82% of consumers purchasing it during their typical grocery shopping trip.
Grocery Store Survey Background & Methodology
In April 2024, Drive Research conducted an online survey that included 17 questions. The survey received 1,000 census representative responses.
With a probabilistic sample, a total of 1,000 responses at the 95% confidence level offers a 3.1% margin of error. If the survey were conducted with another random pool of 1,000 respondents, the results would yield within +3.1% or -3.1% of the stated totals in the reports.
Respondent Profile (By Age)
Baby boomers: 33%
Generation X: 30%
Millennials / Gen Z: 37%
Respondent Profile (By Gender)
Female: 54%
Male: 45%
Non-binary: 1%
Download: State of Grocery Shopping Report
Inside the report, we showcase insights learned from 1,000 grocery shoppers across the U.S. Based on these results, we also share seven shopper profiles that showcase the attributes, motivations, and demographics of varying market segments.
We analyze more than data—we also track how our site is used to improve your experience. Cookies help us understand what’s working so we can deliver the most relevant insights. Click “Accept” to enable full functionality.
Functional
Always active
The technical storage or access is strictly necessary for the legitimate purpose of enabling the use of a specific service explicitly requested by the subscriber or user, or for the sole purpose of carrying out the transmission of a communication over an electronic communications network.
Preferences
The technical storage or access is necessary for the legitimate purpose of storing preferences that are not requested by the subscriber or user.
Statistics
The technical storage or access that is used exclusively for statistical purposes.The technical storage or access that is used exclusively for anonymous statistical purposes. Without a subpoena, voluntary compliance on the part of your Internet Service Provider, or additional records from a third party, information stored or retrieved for this purpose alone cannot usually be used to identify you.
Marketing
The technical storage or access is required to create user profiles to send advertising, or to track the user on a website or across several websites for similar marketing purposes.