In today’s rapidly evolving business landscape, staying ahead of the competition requires more than just a great product or service. It demands a deep understanding of the market, consumer behavior, and emerging trends. This is where the market research process becomes invaluable. In this blog post, we will delve more into market research and explore...
There is never a wrong time to do market research. However, most research projects are birthed because a company or organization is at a crossroads. Whether you’re a startup or Fortune 500 company, you’ll have critical decisions to make. This blog will detail common market research examples and how our clients have used them to...
What is Multivariate Analysis? [+Types & Examples]
George Kuhn
Multivariate analysis is like a powerful magnifying glass for data enthusiasts. It’s a set of techniques that helps us make sense of complex information by examining multiple variables at once.
Imagine you have a basket of fruits with various characteristics like weight, color, and sweetness. Multivariate analysis allows us to unravel how these traits relate to each other, revealing hidden patterns and insights.
In this blog post, we’ll dive deeper into multivariate analysis, exploring its types and providing examples to showcase how it uncovers valuable information for various objectives.
Gain deeper insights with our multivariate analysis expertise. Let us uncover hidden patterns in your data.
Multivariate analysis is any type of statistical analysis that reviews more than one variable.
There is a lot of value in comparing the importance or impact of specific variables. For example, if you are launching a new product or service and the likelihood of purchasing is extremely low based on your survey results, you’ll want to know if this was caused by price, features, color, design, etc.
Using multivariate techniques in market research helps add clarity to this process and supports a data-driven strategic approach.
As I mentioned to a client the other day, “It helps quantify your gut feeling.”
How Multivariate Analysis Can Be Useful For Your Brand
As I mentioned to a client the other day, “It helps quantify your gut feeling.”
One of the most common client situations: a leadership team has 10 things they think they should fix or improve, but limited budget and bandwidth to tackle all of them.
Multivariate analysis can help produce a ranked list that shows what actually moves the needle and what doesn’t.
It can help:
Find the variables that actually drive customer loyalty
Identify your more profitable audience segments (to help spread your budget proportionally)
Reduces new product launch risk
It’s important to consider because it helps you diagnose your brand’s core issues, so you’re not solving the wrong problems.
The main idea is you don’t want to argue over opinions. You want to start making decisions based on what your data proves.
Categories of Multivariate Analysis
1. Multiple Regression
This uses your long list of grid satisfaction ratings and works them into a model to predict which factor has the most impact on overall satisfaction or likelihood to purchase. It’s used often in forecasting.
It starts by asking your respondents their overall likelihood to purchase on a 1-10 scale followed by asking them the appeal of each of the following features (price, feature 1, feature 2, color, etc.) using the same 1-10 scale.
Using regression analysis you will discover the feature has the most significant impact on the likelihood of purchase.
Therefore it helps you understand priorities as to what features or benefits might cause a product failure and what needs improvement.
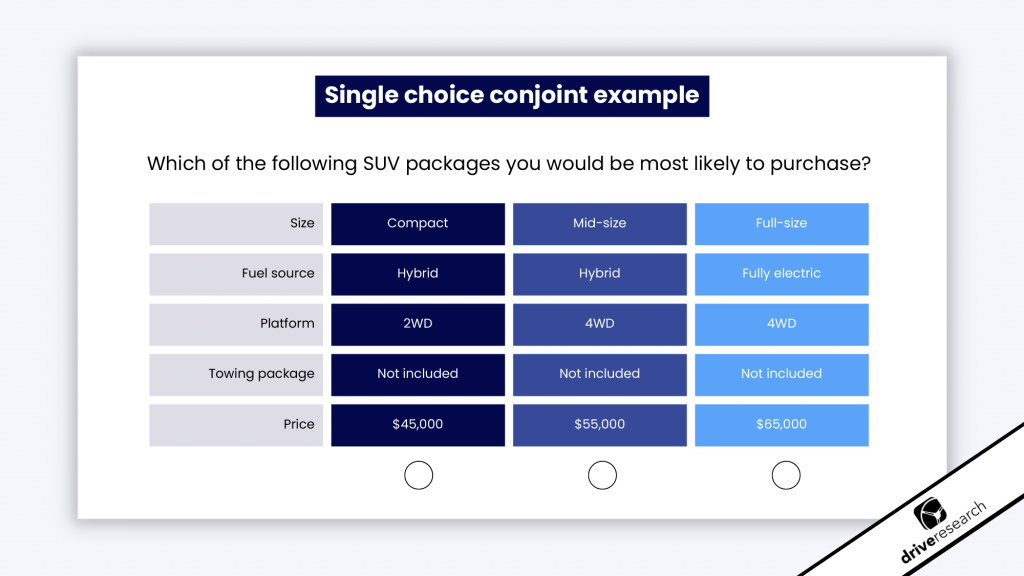
2. Conjoint Analysis
This is most closely associated with “trade-off.” It is asking…
Would you rather have feature 1 or feature 2?
Would you rather have color options or a lower price?
Would you rather have feature 1 or color options?
In online survey research, conjoint analysis is a common form of trade-off analysis.
Just keep in mind, that if you have a long list of factors it may seem very repetitive to the survey taker, so look for ways to randomize lists across a series of respondents or limit your factors.
Long statistical models like this in surveys often increase the rate of drop-outs.
3. Factor Analysis
Factor analysis helps categorize variables into smaller sets or themes so the data can be organized and understood more easily.
If you have 10 survey questions that correlate with each other or ask about the same core topic, they probably measure a similar concept, and they can be grouped together in one “factor”.
You’d typically use factor analysis in:
Brand perception studies: You might ask 25 questions about a brand, and factor analysis reveals 4 variables: trust, quality, value, and emotional connection
Customer satisfaction surveys: Instead of 30 individual satisfaction drivers, factor analysis might place them into 3 factors: service quality, product performance, and price fairness
Product development research: Factoring can help identify the product features that respondents mentally group together, making your study easier to understand.
You’ll want to know that factor analysis typically requires higher data sets for a factor to be considered as a good option in your market research.
You’ll also want to make sure that the variables you’re grouping together are actually practical, since some can statistically be similar but not be the same topic to a respondent.
4. Cluster Analysis
Cluster analysis groups respondents into segments based on their similarities. It’s the same concept as factor analysis, but it groups respondents rather than variables.
This can be an important use in segmentation or message testing, where you want to measure different audiences separately. The main examples in practice are when you’re segmenting customers (based on attitudes, behaviors, or needs) to develop a strategy, or when you’re segmenting markets to identify your different audiences.
There’s no right answer to how many clusters to use. It all depends on your data set.
Clusters depend on the data you input, so make sure it’s clear and of high quality; otherwise, your clusters that are selected might not always be clear why they were chosen.
5.Discrete Choice Modeling (DCM)
This is similar to traditional trade-off conjoint but typically includes a series of variables. In this example of multivariate analysis, the survey designer creates a packaged concept and forces a choice. Think of it as almost a Package A or Package B question.
What is an Example of a Multivariate Analysis?
Imagine you work for a retail company that sells a wide range of products.
The company has gathered data on various customer attributes such as age, income, spending habits in different product categories (e.g., electronics, clothing, groceries), and their frequency of visits to the store.
The goal of the company is to understand its customer base better in order to tailor marketing strategies and product offerings more effectively. They want to identify distinct customer segments based on these attributes.
Here’s how multivariate analysis can be applied:
Data collection: Conduct an online survey to collect data on customer attributes: age, income, spending habits, visit frequency, etc.
Applying multivariate analysis: The analysis will identify new “principal components” that capture the most significant patterns of variation in the data.
Customer segmentation: Using the scores on the retained principal components for each customer, you can now perform clustering techniques to group customers into market segments based on their similarities in terms of the principal components.
Tailor marketing strategies for each customer segment: For example, if one segment is characterized by high spending on electronics, the company might target them with electronics promotions or advertisements.
In this example of multivariate analysis, the retail company is able to distill the complexity of customer data into a smaller set of meaningful components. This allows for a more focused and effective approach to customer segmentation and marketing strategies.
FAQs About Multivariate Analysis in Market ResearchFAQs About Multivariate Analysis in Market Research
How large does my survey sample need to be for multivariate analysis?
Sample size requirements vary by technique. As a general rule, multiple regression typically needs at least 10 to 20 respondents per predictor variable. If you’re testing 10 drivers of satisfaction, you want at least 200 completed surveys. Factor analysis is most stable with 300 or more respondents. Cluster analysis can work with smaller samples but produces more reliable, actionable segments at 300 to 500+. Conjoint analysis has design-specific requirements that depend on the number of attributes and levels being tested. A good market research partner will help you determine the right sample size during the study design phase, before data collection begins.
What is key driver analysis, and how does it work?
Key driver analysis works by asking respondents to rate their overall experience (or satisfaction, likelihood to recommend, purchase intent, etc.) alongside a series of individual attribute ratings, things like price fairness, product quality, customer service, and ease of use. The output is a ranked priority list of drivers, showing your client exactly where to focus resources for maximum impact on the outcome metric that matters most to their business.
Contact Drive Research for Multivariate Analysis
Drive Research is a national market research company. Our team has a combined 80+ years of experience working with advanced survey analysis techniques such as multivariate analysis. If you are interested in working with our full-service online survey company, contact us today.
We analyze more than data—we also track how our site is used to improve your experience. Cookies help us understand what’s working so we can deliver the most relevant insights. Click “Accept” to enable full functionality.
Functional
Always active
The technical storage or access is strictly necessary for the legitimate purpose of enabling the use of a specific service explicitly requested by the subscriber or user, or for the sole purpose of carrying out the transmission of a communication over an electronic communications network.
Preferences
The technical storage or access is necessary for the legitimate purpose of storing preferences that are not requested by the subscriber or user.
Statistics
The technical storage or access that is used exclusively for statistical purposes.The technical storage or access that is used exclusively for anonymous statistical purposes. Without a subpoena, voluntary compliance on the part of your Internet Service Provider, or additional records from a third party, information stored or retrieved for this purpose alone cannot usually be used to identify you.
Marketing
The technical storage or access is required to create user profiles to send advertising, or to track the user on a website or across several websites for similar marketing purposes.