Over the past few years, there has been a significant increase in the adoption of online grocery shopping. This surge has been fueled by factors such as convenience, time-saving benefits, and the proliferation of mobile apps and online platforms offered by retailers.
As consumer behaviors evolve, it’s important to stay up to date on the latest grocery shopping statistics and trends.
To provide that data, our market research company surveyed over 1,000 consumers across the U.S. to look at the current landscape of online grocery shoppers and how that’s evolved since our surveys in years past.
Top Online Grocery Store Shopping Statistics:
- 22% of consumers use online grocery or delivery services
- Use of grocery delivery services in 2024 have risen by 56% compared to 2022
- Use of grocery curbside or pickup services in 2024 have risen by 100% compared to 2022
- Over 1 in 10 people report curbside pickup is an influential factor in choosing where they grocery shop
- Most shoppers purchase non-perishable packaged foods (78%) and personal care items (77%) while grocery shopping online
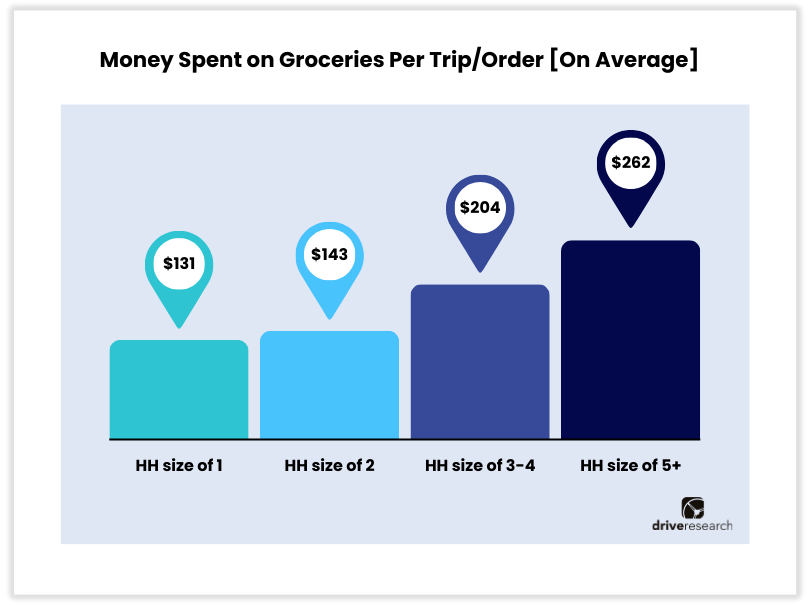
Online Grocery Shopping Spending
On average, people spend $174 on groceries per trip/order in 2024
According to our online grocery store shopping survey, on average consumers spend $174 on groceries per shopping trip or order. This is a 12% increase from the average spent in 2022. This suggests a significant shift in consumer behavior towards increased spending on groceries, possibly influenced by various factors such as inflation, changing dietary habits, or evolving shopping preferences.
Over half of consumers anticipate spending more on groceries in 2024 than 2023 (56%)
This statistic is compelling to our market research company as it indicates a widespread expectation among consumers for increased spending on groceries in the coming year, suggesting potential shifts in economic conditions, dietary preferences, or purchasing habits that could impact the retail food industry.
39% of people spend over their grocery shopping budget each month
This discovery underscores a significant obstacle faced by numerous consumers in sticking to their grocery budgets. With the U.S. Department of Agriculture forecasting a 2.5% overall increase in food prices and a 1.6% rise in food-at-home prices for 2024, it's unsurprising that nearly 40% of individuals are exceeding their designated grocery budgets each month.
Only 7% of people spend under their grocery shopping budget each month
This statistic is intriguing as it highlights a significant majority of consumers consistently exceeding their allocated grocery budgets, suggesting potential challenges in budget management or shifts in spending priorities within households.
17% of grocery shoppers report discounts on delivery/curbside pickup as an enticing offer for grocery stores to provide
Discounts serve as a powerful incentive to attract customers to use delivery or curbside pickup services, especially for those who prioritize cost savings.
Customers may also be inclined to purchase more items or shop more frequently to take advantage of the discount, leading to increased sales for the grocery store.
According to our data, other enticing offers include low everyday pricing (71%), weekly ad specials (51%), and digital coupons (45%).
Online Grocery Shopping Items People Purchase
Most U.S. shoppers purchase non-perishable packaged foods (78%) and personal care items (77%) while grocery shopping online (Statista)
This is likely driven by factors such as convenience, shelf-life considerations, and the ease of selecting these items without the need for physical inspection, reflecting evolving consumer behaviors in the digital era. Other popular items grocery shoppers purchase online include home care items like detergents (73%) and soft drinks (67%).
Snack foods are more commonly purchased by larger household sizes
In homes with five or more residents, snack foods like chips, cookies, crackers, and dried fruit ranked as the second most commonly bought grocery item at 85%, just behind fresh produce at 88%. On the other hand, households with 1-4 people tended to prioritize dairy products and fresh produce as their typical grocery purchases.
Where People Online Grocery Shop
Walmart earns the highest grocery e-commerce revenue (Capital One)
Walmart grocery e-commerce represents 28.4% of the U.S. online grocery market share. It is estimated that in 2025, digital consumers will spend an estimated $63.79 billion on Walmart groceries.
Instacart has nearly 10 million active users (Influencer Marketing Hub)
Instacart is an online grocery delivery and pickup service that allows customers to order groceries and household essentials from local stores through a mobile app or website, with the convenience of same-day delivery or scheduled pickups. With nearly 10 million active users it is the most popular app for online grocery shopping.
22% of consumers use online grocery or delivery services
This information helps businesses adapt their strategies to meet the demand for convenient and flexible shopping options, potentially leading to the development of more efficient delivery services and improved online shopping platforms.
Additionally, it highlights the importance of investing in digital infrastructure and marketing strategies to effectively reach and serve this segment of the market.
The most common grocery store locations where people shop include:
- Mainstream grocery chain (i.e., Safeway, Kroger): 61%
- Mass merchandiser (i.e., Target, Walmart): 56%
- Club store (i.e., Costco, Sam’s): 34%
- Dollar store (i.e., Dollar General, Family Dollar): 29%
- Online retailer (i.e., Amazon, Walmart.com): 26%
- Online grocery or delivery service (i.e., Instacart): 22%
- Natural/specialty grocery chain (i.e., Whole Foods): 22%
- Local independent grocery: 21%
- Drug store (i.e., CVS, Walgreens): 14%
- Farmers market: 12%
- Meal kit subscriptions: 6%
- Click-and-collect or curbside pick-up service: 6%
![Where People Purchase Groceries [Chart]](/media/6174/where-people-purchase-groceries.png)
Use of grocery delivery services in 2024 have risen by 56% compared to 2022
While most shoppers are still grocery shopping in-person, our retail market research company found there was a notable increase in the use of delivery and curbside pickup services from 2022 to 2024.
- Usage of grocery delivery services: 16% in 2022 ➡️ 25% in 2024 (+56%)
- Usage of grocery curbside or pickup services: 6% in 2022 ➡️ 12% in 2024 (+100%)
This trend is beneficial for grocery stores as it indicates a growing demand for delivery and curbside pickup services, allowing them to adapt their business models to meet evolving consumer preferences and capture additional revenue streams from online sales channels.
Curbside pickup (12%) and delivery (59%) are influential offers for shoppers when choosing a grocery store
This data suggests that curbside pickup and delivery options carry weight in consumers' decisions when selecting a grocery store, highlighting the importance for retailers to prioritize and optimize these services to attract and retain customers in a competitive market.
Other influential factors for choosing a grocery store include prices (72%), location (59%), quality of products (57%), and variety of products (54%).
How Often People Grocery Shop Online
On average, people shop at 2 grocery stores per week
On average, Americans typically patronize two grocery outlets per week, whether they are brick-and-mortar stores or online delivery/pickup services. This behavior could stem from a desire to optimize savings, access a wider array of products, and capitalize on distinct promotions or discounts available at each establishment.
40% of consumers report ordering groceries online weekly (Chicory)
Knowing that 40% of consumers are ordering groceries online every week is super helpful! It gives us insight into how shopping habits are changing and helps businesses understand the growing demand for online grocery services. This information can guide retailers in adapting their strategies to better meet the needs of customers who prefer the convenience of online shopping.
In 2024, consumers report making 6 grocery store trips/orders per month – down from the average 8 orders in 2022
The decrease in grocery store trips/orders per month from an average of 8 in 2022 to 6 in 2024 may be attributed to several factors. This may include the increased adoption of online grocery shopping, which allows consumers to consolidate their purchases into fewer transactions. Additionally, advancements in delivery services and the availability of subscription models may contribute to fewer individual trips to physical stores.
Online Grocery Shopping FAQ
Is online grocery shopping increasing?
Yes, online grocery shopping is increasing. For context, in 2024 usage of grocery delivery services increased by 56% from 2022 and usage of grocery curbside or pickup services increased by 100% from 2022.
How often do people buy groceries online?
People are frequently buying groceries online with 40% of consumers doing so weekly. Additionally, grocery shoppers make an average of 2 trips/orders per week.
What is the market size for online groceries?
The global online grocery market is expected to expand significantly, with its value projected to surge from USD 365.74 billion in 2022 to USD 2,827.63 billion by 2032, reflecting a compound annual growth rate (CAGR) of 22.69% throughout the forecast period.
Grocery Store Survey Background & Methodology
In April 2024, Drive Research conducted an online survey that included 17 questions. The survey received 1,000 census representative responses.
With a probabilistic sample, a total of 1,000 responses at the 95% confidence level offers a 3.1% margin of error. If the survey were conducted with another random pool of 1,000 respondents, the results would yield within +3.1% or -3.1% of the stated totals in the reports.
Respondent Profile (By Age)
- Baby boomers: 33%
- Generation X: 30%
- Millennials / Gen Z: 37%
Respondent Profile (By Gender)
- Female: 54%
- Male: 45%
- Non-binary: 1%
Contact Our Market Research Company
As the battle for market share continues to grow, grocery and retail brands are turning to market research to understand what draws customers to the stores they love.
As a full-service market research company, our team offers a wide array of quantitative and qualitative studies. We specialize in insights and consumer behavior analysis that allow your organization to quickly adjust to the latest and greatest shopping trends.
Whether Drive Research executes a survey, focus group, or mystery shop - you will receive the quality, actionable data needed to become consumers' store of choice.
Contact us to learn more about our services:
- Message us on our website
- Email us at [email protected]
- Call us at 888-725-DATA
- Text us at 315-303-2040

Emily Rodgers
A SUNY Cortland graduate, Emily has taken her passion for social and content marketing to Drive Research as the Senior Marketing Manager. She has earned certificates for both Google Analytics and Google AdWords.
Learn more about Emily, here.