Businesses often measure perception among customers and non-customers for their products and services to remain competitive. It tells brands how their organization is viewed and how this may differ from internal stakeholders.
A result of gathering this insight is a perception score. To reap the most benefits of this calculation is to measure it over time and compared to key competitors.
Looking for more? Find details on what perception score is, how to ask perception in a survey, how to calculate perception score, and what perception score results look like below!
What is a Perception Score?
A perception score is a numerical value used to understand the results of a perception survey question.
By using a numerical value to understand perception score, brands are easily able to understand how highly it is viewed, how perception has changed over time, and how its perception compares to the competition.
By measuring perception over time, brands are able to see how it changes from year to year as updates and changes are made to the product, services, and market.
Additionally, measuring the perception score of key competitors allows a brand to understand how it ranks in comparison to other brands tested.
It creates a benchmark for your organization to measure against.
Here are more market research benchmarks to start measuring!
Recommended Reading: Brand Perception Surveys: Definition, Process, and Sample Questions
Example Question to Calculate a Perception Score
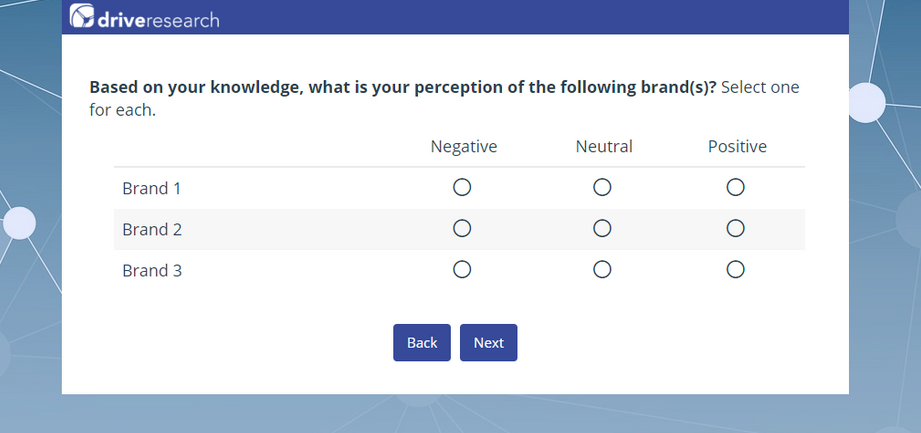
Calculating a perception score is easy! Here's how it is commonly asked in a market research survey.
Question: "What is your perception of the following brand(s)? Select one for each."
Answer options include negative, neutral, and positive.
For some surveys, this can include strongly positive, somewhat positive, neutral, somewhat negative, and very negative. We decided to choose the simple route for this example.
Here's an example of how to ask perception score in a survey.
💡 Pro Tip: Each brand listed should be randomized for every respondent.
These response options should be flipped for each respondent.
Meaning for some respondents, the answer choices will be listed as negative to positive, and for others, it will be listed as positive to negative.
This helps prevent order bias, which is when respondents are drawn to an answer because it is the first option shown.
How is the Perception Score Calculated?
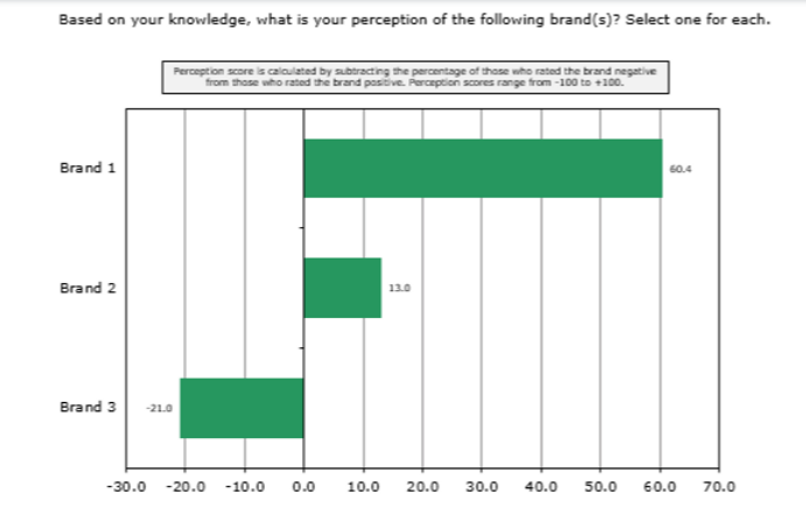
Perception score is calculated by subtracting the percentage of those who rated the brand negative from those who rated the brand positive (i.e. % negative - % positive).
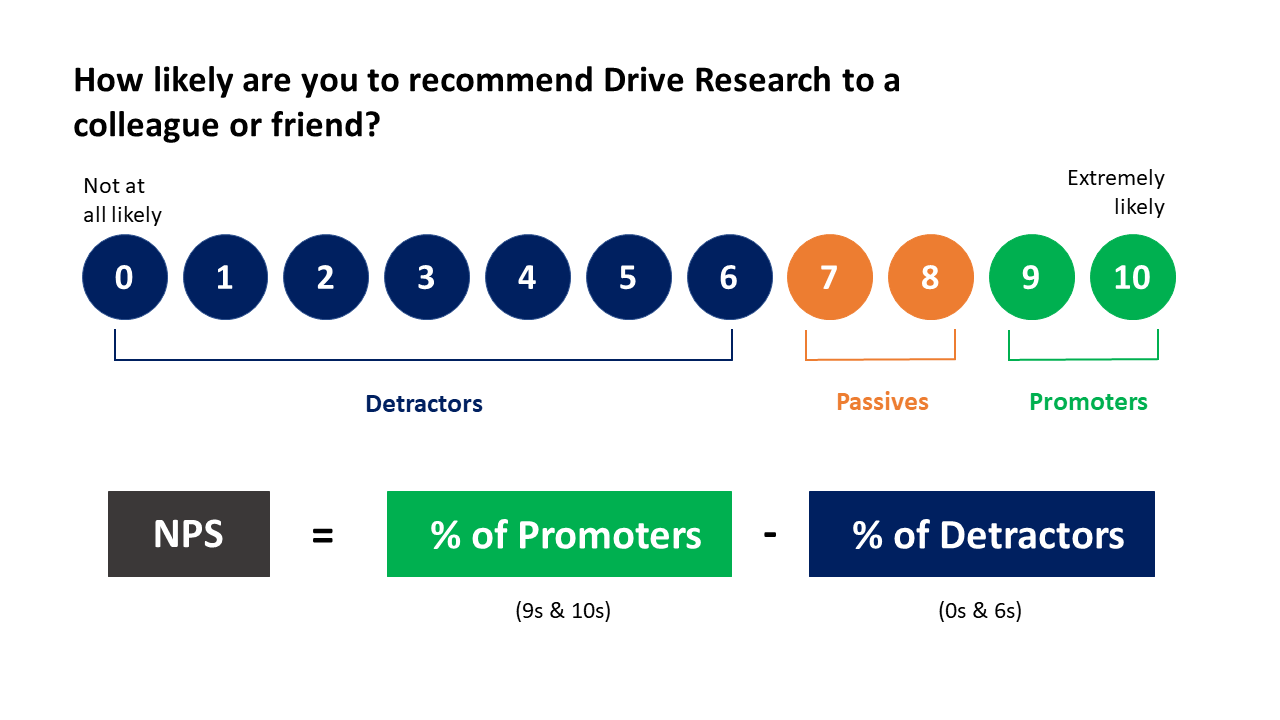
In other words, it is the difference between positives and negatives. This is loosely based on the Net Promoter Score (NPS) calculation.
Perception scores range from -100 to +100, much like NPS.
Calculating perception score places positive emphasis on those who rate the brand positively and negative emphasis on those who rate the brand negatively.
Those who rate the brand-neutral do not move the perception score towards the positive or negative end of the spectrum.
What is a Good Perception Score?
Ideally, brands want to see scores in the positive range. This means more perceive the brand positively than negatively.
Having a score of 0 means most have a neutral perception and can be swayed to move towards positive.
Finally, having a negative score, means most perceive the brand negatively.
Efforts should be made to understand what effects perception score and how to move more to perceive the brand positively.
Much like NPS, it is easier to shift those who have lukewarm perceptions to positive perceptions than it is to switch those who have negative perceptions to positive perceptions.
Perception Score Results
As discussed above, scores range from -100 to +100, so the x-axis will be updated based on the results of each survey.
Perception scores are often shown in a bar chart, see the example below.
When comparing results of perception score over time, results are shown in a dashboard chart to show the old perception score(s), the latest perception score, and note if the score has changed.
This allows brands to understand changes in perception at a glance. This is much like a scorecard of KPIs.
Want to know more important key performance indicators (KPIs)? Learn other KPIs your business should be measuring!
Measure Your Brand Perception Score with Drive Research
Drive Research is a national market research survey company. We offer a variety of custom market research services including online surveys, focus groups, mystery shopping, and more.
Have questions about a new project for us? Or, need advice on an upcoming survey?
Contact us!
- Message us on our website
- Email us at [email protected]
- Call us at 888-725-DATA
- Text us at 315-303-2040

Emily Taylor
As a Senior Research Analyst, Emily is approaching a decade of experience in the market research industry and loves to challenge the status quo. She is a certified VoC professional with a passion for storytelling.
Learn more about Emily, here.