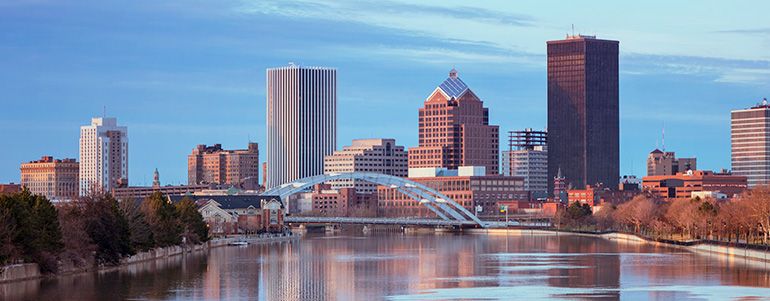
Rochester Market Research Company
Drive Research is a market research company serving Rochester, NY. Our market research company assists businesses and organizations in Upstate New York with their market research objectives.
Although market research in Rochester is a large focus for our company, our market research services span across the country. As a market research company in Rochester, our team can manage all aspects of your project.
Although we are based outside of Syracuse, NY, we like to call Rochester our second home in Upstate. Maybe it's the friendly people or maybe it's Dinosaur BBQ being located in both cities. Either way, we are willing to answer any questions you might have about Rochester market research.
Our market research services include both qualitative and quantitative market research. Where qualitative is more subjective acquiring deeper insights, quantitative is more objective acquiring measurable insights.
Qualitative Market Research Services in Rochester
Our qualitative market research in Rochester includes services like focus groups and in-depth telephone interviews (IDIs).
A focus group is made up of 4 to 12 recruited participants and led by a moderator. The moderator works with your organization to design a custom guide of questions which is then posed to the group of participants. This allows the moderator to dive deep into mindsets, thoughts, and opinions in real-time. Focus groups are an excellent way to explore the appeal of new concepts, products, or services.
In-depth telephone interviews provide a similar value to organizations in Rochester. They are 1-on-1 which eliminates group bias and are more convenient for respondents than asking them to travel in-person to a focus group.
Other qualitative market research includes website user experience (UX) interviews. These website UX interviews are ideal for any company looking to revamp or restructure its website. These UX interviews enable your company to collect feedback directly from users so the website addresses the needs and wants of this audience.
Quantitative Market Research Services in Rochester
The most popular quantitative methodology among clients who utilize our market research company in Rochester is online surveys. These online surveys are designed to be PC, mobile, and tablet friendly, allowing all who access the survey to have a responsive design. Online surveys are inexpensive, offer a quick turnaround, and produce high-quality data.
Our Rochester market research also includes more traditional services such as telephone surveys and mail surveys. Our market research company in Rochester specializes in Voice of Customer (VoC) and Customer Experience (CX) market research.
Interested in learning more about our services or need a quote? Contact our Rochester market research firm today.
Rochester Market Data
The market data below is specific to the 7 county Rochester market. This Rochester market research highlights data for population, households, income, housing, and employment.
Our market research company in Rochester has access to detailed and syndicated resources which can highlight demographics of your customers, non-customers, the market, and your competitors. This is true for both B2B and B2C market research in Rochester.
Rochester Designated Market Area (DMA)
The DMA is made up of 7 counties in the Western New York region. These 7 counties include:
- Genesee
- Livingston
- Monroe
- Ontario
- Orleans
- Wayne
- Yates
Population
The 2016 population estimate in the Rochester DMA is 1,093,346. The 2010 Census revealed a population of 1,079,668, and in 2000 it was 1,062,461 representing a 1.6% change. It is projected the population in this area will be 1,112,917 in 2021, representing a change of 1.8% from 2016. The current population is 48.7% male and 51.3% female.
In 2016, the median age of the population the Rochester DMA was 39.9, compared to the Entire US median age which was 37.7. The population density in the area is 326.4 people per square mile.
Households
There are currently 436,715 estimated households in this geography. The Census revealed household counts of 430,071 in 2010 and 406,343 in 2000, representing a change of 5.8%. It is projected the number of households in this area will be 449,174 in 2021, representing a change of 2.9% from the current year.
In 2010, the average number of years in residence in this Rochester DMA's population was 14.6. The average household size in this geography was 2.4 people and the average family size was 3.1 people. The average number of vehicles per household in this geography was 1.8.
Income
In 2016, the median household income in the Rochester DMA was $52,755, compared to the Entire US median which was $55,159. The Census revealed median household incomes of $50,527 in 2010. It is projected the median household income in this area will be $61,305 in 2021, which would represent a change of 16.2% from the current year.
In 2016, the per capita income in this area was $27,312, compared to the Entire US per capita, which was $28,088. The 2016 average household income for this area was $28,952, compared to the Entire US average which was $30,249.
Housing
The median housing value in this area was $93,527 in 2000. Compare this to the Entire US median of $110,813 for the same year. The estimated median housing value in 2016 in the Rochester DMA is $131,629. Compare this to the Entire US median of $190,673 for the same year.
In 2010 there were 91.5% owner occupied housing units in this area versus 91.5% estimated in 2016. Also in 2010, there were 0.3% renter occupied housing units in this area versus 0.3% estimated in 2016.
Employment
In 2016, there were 890,093 people over the age of 16 in the labor force in your geography. Of these, 94.1% were employed, 5.8% were unemployed, 38.0% were not in the labor force and 0.1% were in the Armed Forces.
In 2016, Civilian unemployment in this area was 5.8%. In Q4 2016, there were 512,850 employees in this selected area (daytime population) and there were 34,043 establishments. For this area in 2016, white collar workers made up 64.2% of the population, and those employed in blue collar occupations made up 18.4%. Service and Farmworkers made up 17.4% of the population. In 2010, the average time traveled to work was 22 minutes.